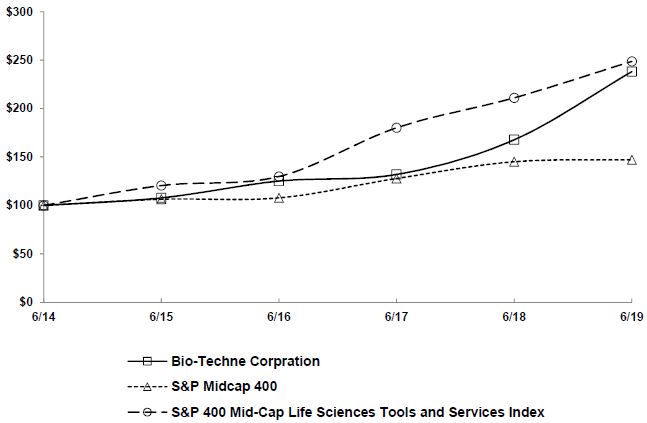
Fiscal year ending June 30.
Copyright© 2019 Standard & Poor's, a division of S&P Global. All rights reserved.
UNITED STATES
SECURITIES AND EXCHANGE COMMISSION
Washington, DC 20549
FORM 10-K
|
☒ |
ANNUAL REPORT PURSUANT TO SECTION 13 OR 15(d) OF THE SECURITIES EXCHANGE ACT OF 1934 |
For the fiscal year ended June 30, 2019, or
|
☐ |
TRANSITION REPORT PURSUANT TO SECTION 13 OR 15(d) OF THE SECURITIES EXCHANGE ACT OF 1934 |
For the transition period
from to
Commission file number 0-17272
BIO-TECHNE CORPORATION
(Exact name of registrant as specified in its charter)
|
Minnesota |
|
41-1427402 |
|
(State or other jurisdiction of incorporation or organization) |
|
(I.R.S. Employer Identification No.) |
|
|
|
|
|
614 McKinley Place N.E. Minneapolis, MN 55413 |
|
(612) 379-8854 |
|
(Address of principal executive offices) (Zip Code) |
|
(Registrant's telephone number, including area code) |
Securities registered pursuant to Section 12(b) of the Act:
|
Title of each class |
Trading Symbol(s) |
Name of each exchange on which registered |
|
Common Stock, $0.01 par value |
TECH |
The NASDAQ Stock Market LLC |
Securities registered pursuant to Section 12(g) of the Act: None
Indicate by check mark if the registrant is a well-known seasoned issuer, as defined in Rule 405 of the Securities Act. Yes ☒ No ☐
Indicate by check mark if the registrant is not required to file reports pursuant to Section 13 or Section 15(d) of the Act. Yes ☐ No ☒
Indicate by check mark whether the registrant (1) has filed all reports required to be filed by Section 13 or 15(d) of the Securities Exchange Act of 1934 during the preceding 12 months (or for such shorter period that the registrant was required to file such reports), and (2) has been subject to such filing requirements for the past 90 days. Yes ☒ No ☐
Indicate by check mark whether the registrant has submitted electronically every Interactive Data File required to be submitted pursuant to Rule 405 of Regulation S-T during the preceding 12 months (or for such shorter period that the registrant was required to submit such files). Yes ☒ No ☐
Indicate by check mark if disclosure of delinquent filers pursuant to Item 405 of Regulation S-K is not contained herein, and will not be contained, to the best of registrant’s knowledge, in definitive proxy or information statements incorporated by reference in Part III of this Form 10-K or any amendment to this Form 10-K. ☒
Indicate by check mark whether the registrant is a large accelerated filer, an accelerated filer, a non-accelerated filer, smaller reporting company or an emerging growth company. See the definitions of “large accelerated filer,” “accelerated filer,” “smaller reporting company” and “emerging growth company” in Rule 12b-2 of the Exchange Act. (Check one):
|
Large accelerated filer |
|
☒ |
|
Accelerated filer |
|
☐ |
|
|
|
|
|
|||
|
Non-accelerated filer |
|
☐ |
|
Smaller reporting company |
|
☐ |
|
|
|
|
|
|
|
|
|
|
|
|
|
Emerging growth company |
|
☐ |
If an emerging growth company, indicate by check mark if the registrant has elected not to use the extended transition period for complying with any new or revised financial accounting standards provided pursuant to Section 13(a) of the Exchange Act. ☐
Indicate by check mark whether the registrant is a shell company (as defined in Rule 12b-2 of the Act). Yes ☐ No ☒
As of December 31, 2018 the aggregate market value of the Common Stock held by non-affiliates of the Registrant was $5.5 billion based upon the closing sale price as reported on The Nasdaq Stock Market ($144.72 per share). Shares of Common Stock held by each officer and director and by each person who owns 5% or more of the outstanding Common Stock have been excluded.
As of August 26, 2019, 38,063,504 shares of the Company’s Common Stock ($0.01 par value) were outstanding.
DOCUMENTS INCORPORATED BY REFERENCE
Portions of the Company’s Proxy Statement for its 2019 Annual Meeting of Shareholders are incorporated by reference into Part III.
|
|
|
Page |
|
|
|
|
|
Item 1. |
1 |
|
|
|
|
|
|
Item 1A. |
10 |
|
|
|
|
|
|
Item 1B. |
19 |
|
|
|
|
|
|
Item 2. |
19 |
|
|
|
|
|
|
Item 3. |
19 |
|
|
|
|
|
|
Item 4. |
19 |
|
|
|
|
|
|
|
|
|
|
Item 5. |
20 |
|
|
|
|
|
|
Item 6. |
22 |
|
|
|
|
|
|
Item 7. |
Management’s Discussion and Analysis of Financial Condition and Results of Operations |
23 |
|
|
|
|
|
Item 7A. |
35 |
|
|
|
|
|
|
Item 8. |
36 |
|
|
|
|
|
|
Item 9. |
Changes in and Disagreements with Accountants on Accounting and Financial Disclosure |
72 |
|
|
|
|
|
Item 9A. |
73 |
|
|
|
|
|
|
Item 9B. |
74 |
|
|
|
|
|
|
|
|
|
|
Item 10. |
75 |
|
|
|
|
|
|
Item 11. |
75 |
|
|
|
|
|
|
Item 12. |
Security Ownership of Certain Beneficial Owners and Management and Related Shareholder Matters |
75 |
|
|
|
|
|
Item 13. |
Certain Relationships and Related Transactions, and Director Independence |
75 |
|
|
|
|
|
Item 14. |
75 |
|
|
|
|
|
|
Item 15. |
76 |
|
|
|
|
|
|
|
78 |
|
OVERVIEW
Bio-Techne and its subsidiaries, collectively doing business as Bio-Techne Corporation (Bio-Techne, we, our, us or the Company), develop, manufacture and sell life science reagents, instruments and services for the research and clinical diagnostic markets worldwide. With our deep product portfolio and application expertise, we sell integral components of scientific investigations into biological processes and molecular diagnostics, revealing the nature, diagnosis, etiology and progression of specific diseases. Our products aid in drug discovery efforts and provide the means for accurate clinical tests and diagnoses.
During our fiscal year 2019, we operated with two reporting segments – our Protein Sciences segment and our Diagnostics and Genomics segment. Our Protein Sciences segment is a leading developer and manufacturer of high-quality purified proteins and reagent solutions, most notably cytokines and growth factors, antibodies, immunoassays, biologically active small molecule compounds, tissue culture reagents and T-Cell activation technologies. This segment also includes protein analysis solutions that offer researchers efficient and streamlined options for automated western blot and multiplexed ELISA workflow. Our Genomics and Diagnostics segment develops and manufactures diagnostic products, including FDA-regulated controls, calibrators, blood gas and clinical chemistry controls and other reagents for OEM and clinical customers, as well as a portfolio of clinical molecular diagnostic oncology assays, including the ExoDx®Prostate(IntelliScore) test (EPI) for prostate cancer diagnosis. This segment also manufactures and sells advanced tissue-based in-situ hybridization assays (ISH) for research and clinical use.
We are a Minnesota corporation with our global headquarters in Minneapolis, Minnesota. We were founded over forty years ago, in 1976, as Research and Diagnostic Systems, Inc. We became a publicly traded company in 1985 through a merger with Techne Corporation, now Bio-Techne Corporation. Our common stock is listed on the NASDAQ under the symbol “TECH.” We operate globally, with offices in many locations throughout North America, Europe and Asia. Today, our product line extends to over 300,000 products, most of which we manufacture ourselves in multiple locations in North America, England and China.
Our historical focus was on providing high quality proteins, antibodies and immunoassays to the life science research market and hematology controls to the diagnostics market. Over the last six years, we implemented a disciplined strategy to accelerate growth in part by acquiring businesses and product portfolios that leveraged and diversified our existing product lines, filled portfolio gaps with differentiated high growth businesses, and expanded our geographic scope. From fiscal years 2013 through 2019 we have acquired fifteen companies that have expanded the product offerings and geographic footprint of both reporting segments. Recognizing the importance of an integrated, global approach to meeting our mission and accomplishing our strategies, we have maintained many of the brands of the companies we have acquired, but unified under a single global brand -- Bio-Techne.
We are committed to providing the life sciences community with innovative, high-quality scientific tools that allow our customers to make extraordinary discoveries. Our mission is to build “epic tools for epic science.” We intend to build on Bio-Techne’s past accomplishments, high product quality reputation and sound financial position by executing strategies that position us to serve as the standard for biological content in the research market, and to leverage that leadership position to enter the diagnostics and other adjacent markets. Our strategies include:
Continued innovation in core products. Through collaborations with key opinion leaders, participation in scientific discussions and societies, and leveraging our internal talent, we expect to be able to convert our continued significant investment in our research and development activities to be first-to-market with quality products that are at the leading edge of life science researchers’ needs, including expansion of our assay portfolios and products for cancer diagnostics and therapeutics.
Market and geographic expansion. We will continue to expand our sales staff and distribution channels globally in order to increase our global presence and make it easier for customers to transact with us. We will also leverage our existing portfolio to expand our product offerings into novel research fields and further into diagnostics and therapeutics markets, including in cell and gene therapy.
Culture development and talent recruitment and retention. As we continue to grow both organically and through acquisition, we are intentionally fostering an “epic” culture based on the ideals of empowerment, passion, innovation and collaboration. We strive to recruit, train and retain the most talented staff, who will live out those epic ideals and implement our strategies effectively.
Targeted acquisitions and investments. We will continue to leverage our strong balance sheet to gain access to new and differentiated technologies and products that improve our competitiveness in the current market, meet customers’ expanding work flow needs and allow us to enter adjacent markets, and to make investments in key technologies and product lines such as the manufacture of GMP grade reagents to support rapidly expanding immunotherapy markets.
OUR PRODUCTS AND MARKETS
In fiscal 2019, net sales from Bio-Techne’s Protein Sciences and Diagnostics and Genomics segments represented 76% and 24% of consolidated net sales, respectively. Financial information relating to Bio-Techne’s segments is incorporated herein by reference to Note 12 to the Consolidated Financial Statements included in Item 8 of this Annual Report on Form 10-K.
Protein Sciences Segment
The Protein Sciences segment is comprised of divisions with complementary product offerings serving many of the same customers – the Reagent Solutions division and the Analytical Solutions division.
Protein Sciences Segment Products
The Reagents Solutions division consists of specialized proteins, such as cytokines and growth factors, antibodies, small molecules, tissue culture sera and cell selection technologies traditionally used by researchers to further their life science experimental activities and by companies developing next generation diagnostics and therapeutics, especially companies developing cell and gene-based therapeutics. Key product brands include R&D Systems, Tocris Biosciences, Novus Biologicals, Atlanta Biologicals and Quad Technologies. Most recently, we acquired B-MoGen Technologies, which has a non-viral, transposon-based technology for gene editing, a key technology targeted for the cell and gene therapy market. Our combined chemical and biological reagents portfolio provides high quality tools that customers can use in solving the complex biological pathways and glean knowledge that may lead to a more complete understanding of biological processes, and, ultimately, to the development of novel therapeutic strategies to address different pathologies.
The Analytical Solutions division includes manual and automated protein analysis instruments and immunoassays that are used in quantifying proteins in a variety of biological fluids. Products in this division include traditional manual plate-based immunoassays, fully automated multiplex immunoassays on various instrument platforms, and automated western blotting and isoelectric focusing analysis of complex protein samples. Key product brands include R&D Systems and ProteinSimple. A number of our products have been demonstrated to have the potential to serve as predictive biomarkers and therapeutic targets for a variety of human diseases and conditions including cancer, autoimmunity, diabetes, hypertension, obesity, inflammation, neurological disorders, and kidney failure. Immunoassays can also be useful in clinical diagnostics. In fact, we have received Food and Drug Administration (FDA) marketing clearance for a few of our immunoassays for use as in vitro diagnostic devices.
Protein Sciences Segment Customers and Distribution Methods
Our customers for this segment include researchers in academia & government and industry (chiefly pharmaceutical and biotech companies) as well as Diagnostic/Companion Diagnostic and Therapeutic customers, especially customers engaged in the development of cell & gene based therapies. Our biologics line of products in the Analytical Solutions division is used primarily by production and quality control departments at biotech and pharmaceutical companies. We sell our products directly to customers who are primarily located in North America, Europe and China. We have a sales and marketing partnership agreement with Fisher Scientific in order to bolster our market presence in North America and leverage the transactional efficiencies offered by the large Fisher organization. We also sell through third party distributors in China, Japan, certain eastern European countries and the rest of the world. Our sales are widely distributed, and no single end-user customer accounted for more than 10% of the Protein Sciences segment's net sales during fiscal 2019, 2018 or 2017.
Protein Sciences Segment Competitors
With respect to the Reagent Solutions division of this segment, a number of large companies supply the worldwide market for protein-related and chemically-based research and diagnostic reagents, including BD Biosciences, Merck KGaA/EMD Chemicals, Inc., PeproTech, Inc., Abcam plc., and Thermo Fisher Scientific, Inc, as well as a number of smaller, niche competitors. Market success is primarily dependent upon product innovation and quality, selection of products, price and reputation. We believe we are one of the leading world-wide suppliers of cytokine and growth factors in the research market. We further believe that the expansion of our product offering, the recognized quality of our products, and the ability to continue to bring novel, cutting edge products and solutions to the market will allow us to remain competitive in the growing biotechnology research, diagnostic, and therapeutics markets. Our Analytical Solutions division has a number of similar competitors. Our Simple Western platform is a complete replacement for the traditional manual Western blotting technique. As a result, we face competition from the vendors that supply instruments and reagents to traditional Western blot users. These competitors include Bio-Rad Laboratories, Merck KGaA, PerkinElmer and Thermo Fisher Scientific. All of these vendors provide elements of the traditional work flow. Similarly, our SimplePlex platform replaces the traditional manual ELISA assay and introduces an automated multiplex immunoassay feature. Competitors include those who supply instruments and reagents for ELISAs, including Meso Scale Discovery, PerkinElmer, Thermo Fisher, Luminex, Millipore, Molecular Devices, Tecan BioTek, Quanterix and Bio-Rad Laboratories. The primary competitors for our Biologics instrumentation are Agilent Technologies, Danaher and PerkinElmer, as well as GE Healthcare, Shimadzu, Thermo Fisher and Waters. We believe our competitive position is strong due to the unique aspects of our products and our product quality.
Protein Sciences Segment Manufacturing
We are not dependent on key or sole source suppliers for most of our products in the Protein Sciences segment. We develop and manufacture the majority of our proteins using recombinant DNA technology, thus significantly reducing our reliance on outside resources. Our antibodies are produced using a variety of technologies including traditional animal immunization and hybridoma technology as well as recombinant antibody techniques. Our chemical-based small molecule products are synthesized from widely available products.
We manufacture our Analytical Solutions division instrumentation products for this segment at various locations in the United States and Canada. We manufacture our own components where we believe it adds significant value, but we rely on suppliers for the manufacture of some of the consumables, components, subassemblies and autosamplers used with, or included in, our systems, which are manufactured to our specifications. As with other products sold in this segment, we are not dependent on any one supplier and are not required to carry significant amounts of inventory to assure ourselves of a continuous allotment of goods from suppliers. We conduct all final testing and inspection of our products. We have established a quality control program, including a set of standard manufacturing and documentation procedures. All of our Protein Sciences Segment manufacturing sites are ISO 9001 or ISO 13485 certified or are in the process of being ISO certified.
The majority of our Reagent Solutions division products are shipped within one day of receipt of the customers' orders, while most of our Analytical Solutions products are shipped within one to two weeks of receipt of an order.
There was no significant backlog of orders for our Protein Sciences segment products as of the date of this Annual Report on Form 10-K or as of a comparable date for fiscal 2018.
Diagnostics and Genomics Segment
The Diagnostics and Genomics segment also includes two divisions focused primarily in the diagnostics market – the Diagnostics division and the Genomics division.
Diagnostics and Genomics Segment Products
The Diagnostic division consists of regulated products traditionally used as calibrators and controls in the clinical setting. Also included are instrument and process control products for hematology, blood chemistry, blood gases, coagulation controls and reagents used in various diagnostic applications. Often we manufacture these reagents on a custom basis, tailored to a customer's specific diagnostic assay technology. We supply these reagents in various formats including liquid, frozen, or in lyophilized form. Most of these products are sold on an Original Equipment Manufacturer (OEM) basis to instrument manufacturers with most products being FDA-cleared products.
The Genomics division includes products aimed at nucleic acid (RNA or DNA) analysis that can be used for diagnostic or research applications. Key product brands include Advanced Cell Diagnostics, or ACD, and Exosome Diagnostics. ACD products are aimed at RNA analysis of tissue while Exosome Diagnostics focuses on exosome-based liquid biopsy techniques that analyze genes or their transcripts. The first commercialized test from Exosome Diagnostics is a non-invasive urine-based assay for prostate cancer used as an aid in deciding the need for an initial biopsy.
Diagnostics and Genomics Segment Customers and Distribution Methods
Original Equipment Manufacturer (OEM) agreements represent the largest market for our Diagnostics division products. The majority of diagnostics sales are through OEM agreements, but we sell some of our diagnostics products directly to customers and, in Europe and Asia, also through distributors. The customers for the ACD research products include researchers in academia as well as investigators in pharmaceutical and biotech companies. We sell our products directly to those customers who are primarily located in North America, Europe and China, and through distributors elsewhere. In addition to being useful research tools, our RNA in situ hybridization assays have diagnostics applications as well, and several are currently under review by the FDA in partnership with diagnostics instrument manufacturers and pharmaceutical companies. We offer test services using our non-invasive urine-based assays for prostate cancer detection in the United States through a diagnostic laboratory regulated under the Clinical Laboratory Improvement Amendments, or CLIA. Customers are patients prescribed such tests by their physicians.
No customers accounted for 10% or more of the reporting segment's consolidated net sales during fiscal years 2019, 2018, or 2017.
Diagnostics and Genomics Segment Competitors
In the Diagnostics division, the competitors for our hematology controls product line include Danaher Beckman Coulter and Streck. For our other control and calibrator products sold in this division, the principal competitors are Abbott Diagnostics, Beckman Coulter, Inc., Bio-Rad Laboratories, Inc., Siemens Healthcare Diagnostics Inc. and Sysmex Corporation. We compete based primarily on product performance, quality, and price in this division. SeraCare, HyTest Ltd and Thermo Fisher Scientific are additional competitors in the clinical diagnostic manufacturing and reagents markets.
Competitors in the Genomics division are varied, depending on the product line. While there are not any direct competitors for the RNA-based in situ hybridization products sold under the ACD brand, they are intended to be an alternative to immunohistochemistry assays and PCR-based diagnostic tests in certain circumstances. The non-invasive urine-based assay offered under our Exosome Diagnostics brand and used for prostate cancer biopsy decisions is supplemental to blood-based prostate-specific antigen (PSA) tests, and is competitive with some other smaller companies that offer liquid biopsy-based alternatives such as 4kscore offered by Opko Health and SelectMDx offered by MDxHealth.
Diagnostics and Genomics Segment Manufacturing
The primary raw material for our hematology controls products is whole blood. We purchase human blood from commercial blood banks, and porcine and bovine blood from nearby meat processing plants. Although the cost of human blood has increased due to the requirement that it be tested for certain diseases and pathogens prior to use, the higher cost of these materials has not had a material adverse effect on our business thus far. Other controls are derived from various bodily fluids or cells from different animal species, which are then processed in-house to isolate the product of interest or from other bulk reagent suppliers that specialize in certain products. Our other reagent products are manufactured using a variety of suppliers, with no supplier representing a material portion of our business.
Most of the hematology controls products are shipped based on a preset, recurring schedule. However, the majority of our business in this segment are large orders shipped based on our customers' needs; we are highly dependent on our customers’ demand and inventory controls. Consequently, our revenues can vary significantly from quarter to quarter and year to year.
Our Genomics division products and services are all synthesized from widely available products. We typically have several outside sources for all critical raw materials necessary for the manufacture of our products in this division.
There was no significant backlog of orders for our Diagnostics and Genomics segment as of the date of this Annual Report on Form 10-K or as of a comparable date for fiscal 2018.
Geographic Information
Following is financial information relating to geographic areas (in thousands):
|
Year Ended June 30, |
||||||||||||
|
2019 |
2018 |
2017 |
||||||||||
|
Net sales: |
||||||||||||
|
United States |
$ | 391,191 | $ | 346,293 | $ | 313,195 | ||||||
|
EMEA, excluding U.K. |
155,821 | 148,599 | 125,126 | |||||||||
|
U.K. |
34,975 | 33,704 | 28,401 | |||||||||
|
APAC, excluding Greater China |
52,913 | 48,392 | 41,463 | |||||||||
|
Greater China |
57,799 | 47,950 | 39,078 | |||||||||
|
Rest of world |
21,307 | 18,055 | 15,740 | |||||||||
|
Total net sales |
$ | 714,006 | $ | 642,993 | $ | 563,003 | ||||||
|
Year ended June 30, |
||||||||
|
2019 |
2018 |
|||||||
|
Long-lived assets: |
||||||||
|
United States and Canada |
$ | 138,016 | $ | 129,360 | ||||
|
Europe |
14,439 | 14,597 | ||||||
|
China |
1,584 | 1,391 | ||||||
|
Total long-lived assets |
$ | 154,039 | $ | 145,348 | ||||
|
Intangible assets: |
||||||||
|
United States and Canada |
$ | 556,951 | $ | 417,430 | ||||
|
Europe |
16,637 | 21,386 | ||||||
|
China |
5,841 | 7,516 | ||||||
|
Total intangible assets |
$ | 579,429 | $ | 446,332 | ||||
Net sales are attributed to countries based on the location of the customer or distributor. Long-lived assets are comprised of land, buildings and improvements and equipment, net of accumulated depreciation. See the description of risks associated with the Company's foreign subsidiaries in Item 1A of this Annual Report on Form 10-K.
PRODUCTS UNDER DEVELOPMENT
Bio-Techne is engaged in continuous research and development in all of our major product lines. We believe that our future success depends, to a large extent, on our ability to keep pace with changing technologies and market needs.
In fiscal 2019, Bio-Techne introduced approximately 1,400 new products. We also expect to significantly expand our portfolio of products through acquisitions as well as continued product development in our existing businesses. However, there is no assurance that any of the products in the research and development phase can be successfully completed or, if completed, can be successfully introduced into the marketplace.
|
Year Ended June 30, |
||||||||||||
|
2019 |
2018 |
2017 |
||||||||||
|
Research and development expense: |
||||||||||||
|
Protein Sciences Segment |
40,735 | 40,996 | 41,334 | |||||||||
|
Diagnostics & Genomics Segment |
21,678 | 14,095 | 12,180 | |||||||||
|
Corporate |
- | 239 | - | |||||||||
|
Total research and development expense |
$ | 62,413 | $ | 55,329 | $ | 53,514 | ||||||
|
Percent of net sales |
9 |
% |
9 |
% |
10 |
% |
||||||
INTELLECTUAL PROPERTY
Our success depends in part upon our ability to protect our core technologies and intellectual property. To accomplish this, we rely on a combination of intellectual property rights, including patents, trade secrets and trademarks, as well as customary contractual protections.
As of June 30, 2019, we had rights to 211 granted patents and approximately 175 pending patent applications. In particular, products in the Analytical Solutions and Genomics divisions are protected primarily through pending patent applications and issued patents. In addition, certain of our products are covered by licenses from third parties to supplement our own patent portfolio. Patent protection, if granted, generally has a life of 20 years from the date of the patent application or patent grant. We cannot provide assurance that any of our pending patent applications will result in the grant of a patent, whether the examination process will require us to narrow our claims, and whether our claims will provide adequate coverage of our competitors' products or services.
In addition to pursuing patents on our products, we also preserve much of our innovation as trade secrets, particularly in the Reagent Solutions division of our Protein Sciences segment. We have taken steps to protect our intellectual property and proprietary technology, in part by entering into confidentiality agreements and intellectual property assignment agreements with our employees, consultants, corporate partners and, when needed, our advisors. See the description of risks associated with the Company's intellectual property in Item 1A of this Annual Report on form 10-K.
No assurance can be given that Bio-Techne's products do not infringe upon patents or proprietary rights owned or claimed by others. Bio-Techne has not conducted a patent infringement study for each of its products. Where we have been contacted by patent holders with certain intellectual property rights, Bio-Techne typically has entered into licensing agreements with patent holders under which it has the exclusive and/or non-exclusive right to use patented technology as well as the right to manufacture and sell certain patented products to the research and/or diagnostics markets.
Bio-Techne has obtained trademark registration in certain countries for certain of its brand and product names. Bio-Techne believes it has common law trademark rights to certain marks in addition to those which it has registered.
SEASONALITY OF BUSINESS
Bio-Techne believes there is some seasonality as a result of vacation and academic schedules of its worldwide customer base, particularly for the Protein Sciences segment. A majority of Diagnostics division products are manufactured in large bulk lots and sold on a schedule set by the customer. Consequently, sales for that segment can be unpredictable, and not necessarily based on seasonality. As a result, we can experience material and sometimes unpredictable fluctuations in our revenue from this segment.
LAWS AND REGULATIONS
Our operations, and some of the products we offer, are subject to a number of complex and stringent laws and regulations governing the production, marketing, handling, transportation and distribution of chemicals, drugs and other similar products, including the operating and security standards of the Food and Drug Administration, the Drug Enforcement Administration, and various comparable state and foreign agencies. As Bio-Techne’s businesses also include export and import activities, we are subject to pertinent laws enforced by the U.S. Departments of Commerce, State and Treasury. Privacy laws in various jurisdictions impact our business in a number of ways, including requiring us to take care when processing employee and customer data. One of our products under our Exosome Diagnostics brand is offered as a test under a CLIA-certified laboratory; consequently, we must comply with governmental regulations relating to billing practices and financial relationships with physicians, hospitals, and health systems. While we believe we are in compliance in all material respects with such laws and regulations, any noncompliance could result in substantial fines or otherwise restrict our ability to provide competitive distribution services and thereby have an adverse effect on our financial condition. To date, none has had a material impact on our operations.
We are subject to laws and regulations governing government contracts, and failure to address these laws and regulations or comply with government contracts could harm our business by a reduction in revenue associated with these customers. We have agreements relating to the sale of our products to government entities and, as a result, we are subject to various statutes and regulations that apply to companies doing business with the government. We are also subject to investigation for compliance with the regulations governing government contracts. A failure to comply with these regulations could result in suspension of these contracts, criminal, civil and administrative penalties or debarment.
EMPLOYEES
Through its subsidiaries, Bio-Techne employed approximately 2,250 full-time and part-time employees as of June 30, 2019.
INVESTOR INFORMATION
We are subject to the information requirements of the Securities Exchange Act of 1934 (the Exchange Act). Therefore, we file periodic reports, proxy statements, and other information with the Securities and Exchange Commission (SEC). The SEC maintains an internet site (http://www.sec.gov) that contains reports, proxy and information statements, and other information regarding issuers that file electronically.
Financial and other information about us is available on our web site (http://www.bio-techne.com/investors). We make available on our web site copies of our Annual Report on Form 10-K, Quarterly Reports on Form 10-Q, Current Reports on Form 8-K, and amendments to those reports filed or furnished pursuant to Section 13 or 15(d) of the Exchange Act as soon as reasonably practicable after filing such material electronically or otherwise furnishing it to the SEC.
EXECUTIVE OFFICERS OF THE REGISTRANT
Currently, the names, ages, positions and periods of service of each executive officer of the Company are as follows:
|
Name |
|
Age |
|
Position |
|
Officer Since |
|
|
|
|
|
|
|
|
|
Charles Kummeth |
|
59 |
|
President, Chief Executive Officer and Director |
|
2013 |
|
James T. Hippel |
|
48 |
|
Chief Financial Officer |
|
2014 |
|
David Eansor |
|
58 |
|
President, Protein Sciences |
|
2014 |
|
Kim Kelderman |
|
52 |
|
President, Diagnostics and Genomics |
|
2018 |
|
Brenda Furlow |
|
61 |
|
General Counsel and Corporate Secretary |
|
2014 |
Set forth below is information regarding the business experience of each executive officer. There are no family relationships among any of the officers named, nor is there any arrangement or understanding pursuant to which any person was selected as an officer.
Charles Kummeth has been President and Chief Executive Officer of the Company since April 1, 2013. Prior to joining the Company, he served as President of Mass Spectrometry and Chromatography at Thermo Fisher Scientific Inc. from September 2011. He was President of that company's Laboratory Consumables Division from 2009 to September 2011. Prior to Thermo Fisher, Mr. Kummeth served in various roles at 3M Corporation, most recently as the Vice President of the company's Medical Division from 2006 to 2008.
James T. Hippel has been Chief Financial Officer of the Company since April 1, 2014. Prior to joining the Company, Mr. Hippel served as Senior Vice President and Chief Financial Officer for Mirion Technologies, Inc., a $300 million global company that provides radiation detection and identification products. Prior to Mirion, Mr. Hippel served as Vice President, Finance at Thermo Fisher Scientific, Inc., leading finance operations for its Mass Spectrometry & Chromatography division and its Laboratory Consumables division. In addition, Mr. Hippel's experience includes nine years of progressive financial leadership at Honeywell International, within its Aerospace Segment. Mr. Hippel started his career with KPMG LLP.
David Eansor has been the President of the Protein Sciences segment in fiscal 2019. Prior to that, he served as Senior Vice President, Biotechnology Division and as Senior Vice President, Novus Biologicals since the Company completed its acquisition of Novus on July 2, 2014. From January 2013 until the date of the acquisition, Mr. Eansor was the Senior Vice President of Corporate Development of Novus Biologicals. Prior to joining Novus Biologicals, Mr. Eansor was the President of the Bioscience Division of Thermo Fisher Scientific. Mr. Eansor was promoted to Division President in early 2010 after 5 years as President of Thermo Fisher's Life Science Research business.
Kim Kelderman joined Bio-Techne on April 30, 2018 as President, Diagnostics and Genomics. Prior to Bio-Techne, Mr. Kelderman was employed at Thermo Fisher Scientific where he led three different businesses of increasing scale and complexity. For the last three years, Mr. Kelderman managed the Platforms and Content of the Genetic Sciences Division, where he was responsible for the Instrumentation, Software, Consumables and Assays businesses, and brands such as Applied Biosystems and legacy Affymetrix. Before joining Thermo Fisher, Kim served as Senior Segment Leader at Becton Dickinson, managing the global Blood Tubes “Vacutainer” business.
Brenda Furlow joined the Company as General Counsel and Corporate Secretary on August 4, 2014. Prior to joining Bio-Techne, Ms. Furlow served as general counsel to emerging growth technology companies. Ms. Furlow was General Counsel for TomoTherapy, a global, publicly traded company that manufactured and sold radiation therapy equipment, from 2007 to 2011. From 1998 to 2007, Ms. Furlow served as General Counsel for Promega Corporation, a global life sciences company.
FORWARD-LOOKING INFORMATION AND CAUTIONARY STATEMENTS
This report contains forward-looking statements, which are based on the Company's current assumptions and expectations. The principal forward-looking statements in this report include the Company's expectations regarding product releases and strategy, future financial results, acquisition activity, the competitive environment, currency fluctuation and exchange rates, capital expenditures, the performance of the Company's investments, future dividend declarations, the construction and lease of certain facilities, the adequacy of owned and leased property for future operations, anticipated financial results and sufficiency of capital resources to meet the Company's foreseeable future cash and working capital requirements.
All such forward-looking statements are intended to enjoy the protection of the safe harbor for forward-looking statements contained in the Private Securities Litigation Reform Act of 1995, as amended. Although the Company believes there is a reasonable basis for the forward-looking statements, the Company's actual results could be materially different. The most important factors which could cause the Company's actual results to differ from forward-looking statements are set forth in the Company's description of risk factors in Item 1A to this Annual Report on Form 10-K.
Forward-looking statements speak only as of the date they are made, and the Company does not undertake any obligation to update any forward-looking statements.
Statements in this Annual Report on Form 10-K and elsewhere that are forward-looking involve risks and uncertainties which may affect the Company's actual results of operations. Certain of these risks and uncertainties, which have affected and, in the future, could affect the Company's actual results are discussed below. The Company undertakes no obligation to update or revise any forward-looking statements made due to new information or future events. Investors are cautioned not to place undue emphasis on these statements.
The following risk factors should be read carefully in connection with evaluation of the Company's business and any forward-looking statements made in this Annual Report on Form 10-K and elsewhere. See the section entitled “forward-looking statements” set forth above. Any of the following risks or others discussed in this Annual Report on Form 10-K or the Company's other SEC filings could materially adversely affect the Company's business, operating results and financial condition.
It may be difficult for us to implement our strategies for revenue growth in light of competitive challenges.
We face significant competition across many of our product lines. Competitors include companies ranging from start-up companies, which may be able to more quickly respond to customers' needs, to large multinational companies, which may have greater financial, marketing, operational, and research and development resources than the Company. In addition, consolidation trends in the pharmaceutical, biotechnology and diagnostics industries have served to create fewer customer accounts and to concentrate purchasing decisions for some customers, resulting in increased pricing pressure on the Company. Moreover, customers may believe that consolidated businesses are better able to compete as sole source vendors, and therefore prefer to purchase from such businesses. The entry into the market by manufacturers in China, India and other low-cost manufacturing locations is also creating increased pricing and competitive pressures, particularly in developing markets. Failure to anticipate and respond to competitors' actions may impact the Company's future sales and earnings.
To address this issue, we are pursuing a number of strategies to maintain and improve our revenue growth, including:
|
• |
strengthening our presence in selected geographic markets; |
|
• |
allocating research and development funding to products with higher growth prospects; |
|
• |
developing new applications for our technologies; |
|
• |
continuing key opinion leader initiatives; |
|
• |
finding new markets for our products; |
|
• |
acquiring new products and business in growing or novel markets; and |
|
• |
continuing the development of commercial tools and infrastructure to increase and support cross-selling opportunities of products and services to take advantage of our depth in product offerings. |
We may not be able to successfully implement these strategies, and these strategies may not result in the expected growth of our business.
Our acquisition growth strategy poses financial, management and other risks and challenges.
We routinely explore acquiring other businesses and assets, and have completed sixteen acquisitions and several investments in the last seven years. However, we may be unable to identify or complete promising acquisitions for many reasons, including competition among buyers, the high valuations of businesses in our industry, the need for regulatory and other approvals, and availability of capital. There can be no assurance that we will engage in any additional acquisitions or that we will be able to do so on terms that will result in any expected benefits. In addition, acquisitions financed with borrowings could make us more vulnerable to business downturns and could negatively affect our earnings due to higher leverage and interest expense.
Our inability to complete acquisitions or to successfully integrate any new or previous acquisitions could have a material adverse effect on our business.
Our business strategy includes the acquisition of technologies and businesses that complement or augment our existing products and services. Certain acquisitions may be difficult to complete for a number of reasons, including the need for antitrust and/or other regulatory approvals. Any acquisition we may complete may be made at a substantial premium over the fair value of the net identifiable assets of the acquired company. When we do identify and consummate acquisitions, we may face financial, managerial and operational challenges, including diversion of management attention, difficulty with integrating acquired businesses, integration of different corporate cultures, increased expenses, assumption of unknown liabilities, indemnities, potential disputes with the sellers, and the need to evaluate the financial systems of and establish internal controls for acquired entities. Further, we may not be able to integrate acquired businesses successfully into our existing businesses, make such businesses profitable, or realize anticipated cost savings or synergies, if any, from these acquisitions, which could adversely affect our overall business.
We may be required to record a significant charge to earnings if our goodwill and other amortizable intangible assets, or other investments become impaired.
We are required under generally accepted accounting principles to test goodwill for impairment at least annually and to review our goodwill, amortizable intangible assets, and other assets acquired through merger and acquisition activity, for impairment when events or changes in circumstance indicate the carrying value may not be recoverable. Factors that could lead to impairment of goodwill, amortizable intangible assets, and other assets acquired via acquisitions include significant adverse changes in the business climate and actual or projected operating results (affecting our company as a whole or affecting any particular segment) and declines in the financial condition of our business. We may be required in the future to record additional charges to earnings if our goodwill, amortizable intangible assets or other investments become impaired. Any such charge would adversely impact our financial results.
In addition, the Company's expansion strategies include collaborations and investments in joint ventures and companies developing new products related to the Company's business. These strategies carry risks that objectives will not be achieved and future earnings will be adversely affected. For example, the Company has an approximate 7% equity investment in publicly traded ChemoCentryx, Inc. (Nasdaq: CCXI) that is valued at $38.2 million as of June 30, 2019. The ownership of CCXI shares is very concentrated, the share price is highly volatile and there is limited trading of the shares. In fiscal 2017, we also invested and held a minority interest in privately-held Astute Medical, Inc. (Astute), a diagnostics company developing new diagnostics tests relating to kidney injury. In fiscal 2018, Astute was acquired by a third party and we realized a $16.2 million loss on our investment.
Significant developments stemming from the U.S. administration or the U.K.’s referendum on membership in the EU could have an adverse effect on us.
The U.S. administration has called for substantial changes to trade agreements and is imposing significant increases on tariffs on goods imported into the United States, particularly from China. Other countries have responded similarly, with tariffs on goods entering their countries. The U.S. administration has also indicated an intention to ask Congress to make significant changes, replacement or elimination of the Patient Protection and Affordable Care Act, and government negotiation/regulation of drug prices paid by government programs. Changes in U.S. social, political, regulatory and economic conditions or laws and policies governing the health care system and drug prices, foreign trade, manufacturing, and development and investment in the territories and countries where we or our customers operate could adversely affect our operating results and our business.
Additionally, in a referendum vote held on June 23, 2016, the United Kingdom (UK) voted to leave the European Union (EU). This referendum has created political and economic uncertainty, particularly in the United Kingdom and the EU, and this uncertainty may last for years. Our business could be affected during this period of uncertainty, and perhaps longer, by the impact of the United Kingdom’s referendum. In addition, our business could be negatively affected by new trade agreements between the United Kingdom and other countries, including the United States, and by the possible imposition of trade or other regulatory barriers in the United Kingdom. Any of these factors could adversely affect customer demand, our relationships with customers and suppliers, and our business and financial results, particularly since our European headquarters and shipping facilities are currently located in the UK. Additionally, attracting and retaining qualified employees who are citizens of EU countries to our UK facilities may be more difficult given the uncertainties resulting from the UK withdrawal.
Changes in governmental regulations may reduce demand for our products or increase our expenses.
We compete in many markets in which we and our customers must comply with federal, state, local and international regulations, such as environmental, health and safety and food and drug regulations. We develop, configure and market our products to meet customer needs created by those regulations. Any significant change in regulations could reduce demand for our products or increase our expenses. For example, many of our instruments are marketed to the pharmaceutical industry for use in discovering and developing drugs. Changes in the U.S. Food and Drug Administration’s regulation of the drug discovery and development process could have an adverse effect on the demand for these products.
We are subject to laws and regulations governing government contracts, and failure to address these laws and regulations or comply with government contracts could harm our business by leading to a reduction in revenue associated with these customers.
We have agreements relating to the sale of our products to government entities in the U.S. and elsewhere and, as a result, we are subject to various statutes and regulations that apply to companies doing business with the government. The laws governing government contracts differ from the laws governing private contracts and government contracts may contain pricing terms and conditions that are not applicable to private contracts. We are also subject to investigation for compliance with the regulations governing government contracts. A failure to comply with these regulations could result in suspension of these contracts, criminal, civil and administrative penalties or debarment.
We are required to comply with a wide variety of laws and regulations, and are subject to regulation by various federal, state and foreign agencies.
We are subject to various local, state, federal, foreign and transnational laws and regulations, which include the operating and security standards of the U.S. Federal Drug Administration (the FDA), the U.S. Drug Enforcement Agency (the DEA), the U.S. Department of Health and Human Services (the DHHS), and other comparable agencies and, in the future, any changes to such laws and regulations could adversely affect us. In particular, we are subject to laws and regulations concerning current good manufacturing practices and drug safety. Our subsidiaries may be required to register for permits and/or licenses with, and may be required to comply with the laws and regulations of, the DEA, the FDA, the DHHS, foreign agencies and/or comparable state agencies as well as certain accrediting bodies depending upon the type of operations and location of product distribution, manufacturing and sale. The manufacture, distribution and marketing of many of our products and services, including medical devices and pharma services, are subject to extensive ongoing regulation by the FDA, the DEA, and other equivalent local, state, federal and non-U.S. regulatory authorities. In addition, we are subject to inspections by these regulatory authorities. Failure by us or by our customers to comply with the requirements of these regulatory authorities, including without limitation, remediating any inspectional observations to the satisfaction of these regulatory authorities, could result in warning letters, product recalls or seizures, monetary sanctions, injunctions to halt manufacture and distribution, restrictions on our operations, civil or criminal sanctions, or withdrawal of existing or denial of pending approvals, including those relating to products or facilities. In addition, such a failure could expose us to contractual or product liability claims, contractual claims from our customers, including claims for reimbursement for lost or damaged active pharmaceutical ingredients, as well as ongoing remediation and increased compliance costs, any or all of which could be significant. We are the sole manufacturer of a number of products for many of our customers and a negative regulatory event could impact our customers' ability to provide products to their customers.
We are also subject to a variety of federal, state, local and international laws and regulations that govern, among other things, the importation and exportation of products, the handling, transportation and manufacture of substances that could be classified as hazardous, and our business practices in the U.S. and abroad such as anti-corruption and anti-competition laws. Any noncompliance by us with applicable laws and regulations or the failure to maintain, renew or obtain necessary permits and licenses could result in criminal, civil and administrative penalties and could have an adverse effect on our results of operations.
We are subject to financial, operating, legal and compliance risk associated with global operations.
We engage in business globally, with approximately 45% of our sales revenue in fiscal 2019 coming from outside the U.S. In addition, one of our strategies is to expand geographically, particularly in China, India and in developing countries, both through distribution and through direct operations. This subjects us to a number of risks, including international economic, political, and labor conditions; currency fluctuations; tax laws (including U.S. taxes on foreign subsidiaries); increased financial accounting and reporting burdens and complexities; unexpected changes in, or impositions of, legislative or regulatory requirements; failure of laws to protect intellectual property rights adequately; inadequate local infrastructure and difficulties in managing and staffing international operations; delays resulting from difficulty in obtaining export licenses for certain technology; tariffs, quotas and other trade barriers and restrictions; transportation delays; operating in locations with a higher incidence of corruption and fraudulent business practices; and other factors beyond our control, including terrorism, war, natural disasters, climate change and diseases.
The application of laws and regulations implicating global transactions is often unclear and may at times conflict. Compliance with these laws and regulations may involve significant costs or require changes in our business practices that result in reduced revenue and profitability. Non-compliance could also result in fines, damages, criminal sanctions, prohibited business conduct, and damage to our reputation. We incur additional legal compliance costs associated with our global operations and could become subject to legal penalties in foreign countries if we do not comply with local laws and regulations, which may be substantially different from those in the U.S.
We continue to expand our operations in countries with developing economies, where it may be common to engage in business practices that are prohibited by U.S. regulations applicable to the Company, such as the Foreign Corrupt Practices Act. Although we implement policies and procedures designed to ensure compliance with these laws, there can be no assurance that all of our employees, contractors, and agents, as well as those companies to which we outsource certain aspects of our business operations, including those based in foreign countries where practices which violate such U.S. laws may be customary, will comply with our internal policies. Any such non-compliance, even if prohibited by our internal policies, could have an adverse effect on our business and result in significant fines or penalties.
Changes in economic conditions could negatively impact our revenues and earnings.
Our Protein Sciences segment products are sold primarily to research scientists at pharmaceutical and biotechnology companies and at university and government research institutions. Research and development spending by our customers and the availability of government research funding can fluctuate due to changes in available resources, mergers of pharmaceutical and biotechnology companies, spending priorities, general economic conditions and institutional and governmental budgetary policies. Our diagnostics segment products are intended primarily for the medical diagnostics market, which relies largely on government healthcare-related policies and funding. Changes in government reimbursement for certain diagnostic tests or reductions in overall healthcare spending could negatively impact us directly or our customers and, correspondingly, our sales to them. Several years ago, the U.S. and global economies experienced a period of economic downturn and have been slow to recover in some parts of the world. Such downturns, and other reductions or delays in governmental funding, could cause customers to delay or forego purchases of our products. We carry essentially no backlog of orders and changes in the level of orders received and filled daily can cause fluctuations in quarterly revenues and earnings.
Several years ago we identified and remediated material weaknesses in our internal control over financial reporting which, if recurring, could harm our operating results or cause us to fail to meet our reporting obligations.
Our management is responsible for establishing and maintaining adequate internal control over our financial reporting, as defined in Rule 13a-15(f) under the Securities Exchange Act. During fiscal 2016, management identified material weaknesses in our internal control over financial reporting. A material weakness is defined as a deficiency, or combination of deficiencies, in internal control over financial reporting, such that there is a reasonable possibility that a material misstatement of our annual or interim financial statements will not be prevented or detected on a timely basis. As a result of these material weaknesses, our management concluded that our internal control over financial reporting was not effective based on criteria set forth by the Committee of Sponsoring Organization of the Treadway Commission in Internal Control-An Integrated Framework (2013 Framework) for the years ended June 30, 2016 and 2017. In fiscal 2018 we completed a remediation plan that addressed these material weaknesses. As we continue to grow and acquire additional business, we may fail to implement effective internal controls for our recently acquired operations that result in additional material weaknesses, and harm our operating results or cause us to fail to meet our reporting obligations. Inadequate internal controls could also cause investors to lose confidence in our reported financial information, which could have a negative effect on the trading price of our common shares.
Our success will be dependent on recruiting and retaining highly qualified personnel and creating a new culture that includes the employees joining through acquisition.
Recruiting and retaining qualified scientific, production, sales and marketing, and management personnel are critical to our success. Our anticipated growth and its expected expansion into areas and activities requiring additional expertise will require the addition of new personnel and the development of additional expertise by existing personnel. We also operate in several geographic locations where competition for talent is strong, making employee retention particularly challenging in those locations. For example, some of our fastest growing businesses are located in northern California and eastern Massachusetts, both of which currently are experiencing low unemployment and a competitive environment for finding and retaining talent. Our growth by acquisition also creates challenges in retaining employees. As we integrate past and future acquisitions and evolve our corporate culture to incorporate the new workforces, some employees may not find such integration or cultural changes appealing. The failure to attract and retain such personnel could adversely affect our business.
Cyber security risks and the failure to maintain the confidentiality, integrity, and availability of our computer hardware, software, and Internet applications and related tools and functions, could result in damage to our reputation, data integrity and/or subject us to costs, fines, or lawsuits under data privacy or other laws or contractual requirements.
The integrity and protection of our own data, and that of our customers and employees, is critical to our business. The regulatory environment governing information, security and privacy laws is increasingly demanding and continues to evolve. Maintaining compliance with applicable security and privacy regulations may increase our operating costs and/or adversely impact our ability to market our products and services to customers. Although our computer and communications hardware are protected through physical and software safeguards, they are still vulnerable to fire, storm, flood, power loss, earthquakes, telecommunications failures, physical or software break-ins, software viruses, and similar events. These events could lead to the unauthorized access, disclosure and use of non-public information. The techniques used by criminal elements to attack computer systems are sophisticated, change frequently and may originate from less regulated and remote areas of the world. As a result, we may not be able to address these techniques proactively or implement adequate preventative measures. If our computer systems are compromised, we could be subject to fines, damages, litigation, and enforcement actions, customers could curtail or cease using its applications, and we could lose trade secrets, the occurrence of which could harm our business.
If we are unable to maintain reliable information technology systems and appropriate controls with respect to global data privacy and security requirements and prevent data breaches, we may suffer regulatory consequences in addition to business consequences. As a global organization, we are subject to data privacy and security laws, regulations, and customer-imposed controls in numerous jurisdictions as a result of having access to and processing confidential, personal and/or sensitive data in the course of our business. For example, in the United States, individual states regulate data breach and security requirements and multiple governmental bodies assert authority over aspects of the protection of personal privacy. European laws require us to have an approved legal mechanism to transfer personal data out of Europe, and the recently-enacted EU General Data Protection Regulation, which took effect in May 2018, imposes significantly stricter requirements in how we collect and process personal data. Several countries, such as China and Russia, have passed laws that require personal data relating to their citizens to be maintained on local servers and impose additional data transfer restrictions. Government enforcement actions can be costly and interrupt the regular operation of our business, and data breaches or violations of data privacy laws can result in fines, reputational damage and civil lawsuits, any of which may adversely affect our business, reputation and financial statements.
We are dependent on maintaining our intellectual property rights.
Our success depends in part on our ability to protect and maintain our intellectual property, including trade secrets. If we fail to protect our intellectual property, third parties may be able to compete more effectively against us, we may lose our technological or competitive advantage, or we may incur substantial litigation costs in our attempts to recover or restrict use of our intellectual property. We attempt to protect trade secrets in part through confidentiality agreements, but those agreements can be breached, and if they are, there may not be an adequate remedy. If trade secrets become publicly known, we could lose our competitive position.
We also attempt to protect and maintain intellectual property through the patent process. As of June 30, 2019, we owned or exclusively licensed over 400 granted patents and pending patent applications. We cannot be confident that any of our currently pending or future patent applications will result in granted patents, and we cannot predict how long it will take for such patents to be granted. It is possible that, if patents are granted to us, others will design around our patented technologies. Further, other parties may challenge any patents granted to us and courts or regulatory agencies may hold our patents to be invalid or unenforceable. We may not be successful in defending challenges made against our patents and patent applications. Any successful third-party challenge to our patents could result in the unenforceability or invalidity of such patents. Our ability to establish or maintain a technological or competitive advantage over our competitors may be diminished because of these uncertainties. To the extent our intellectual property offers inadequate protection, or is found to be invalid or unenforceable, we would be exposed to a greater risk of direct competition. If our intellectual property does not provide adequate coverage of our competitors' products, our competitive position could be adversely affected, as could our business. Both the patent application process and the process of managing patent disputes can be time consuming and expensive.
We may be involved in disputes to determine the scope, coverage and validity of others' proprietary rights, or to defend against third-party claims of intellectual property infringement, any of which could be time-intensive and costly and may adversely impact our business.
Our success depends in part on its ability to operate without infringing the proprietary rights of others, and to obtain licenses where necessary or appropriate. We have obtained and continue to negotiate licenses to produce a number of products claimed to be owned by others. Since we have not conducted a patent infringement study for each of our products, it is possible that some of our products may unintentionally infringe patents of third parties.
We have been and may in the future be sued by third parties alleging that we are infringing their intellectual property rights. These lawsuits are expensive, take significant time, and divert management's focus from other business concerns. If we are found to be infringing the intellectual property of others, we could be required to cease certain activities, alter our products or processes or pay licensing fees. This could cause unexpected costs and delays which may have a material adverse effect on us. If we are unable to obtain a required license on acceptable terms, or unable to design around any third party patent, we may be unable to sell some of our products and services, which could result in reduced revenue. In addition, if we do not prevail, a court may find damages or award other remedies in favor of the opposing party in any of these suits, which may adversely affect our earnings.
Our ExoDx Prostate(IntelliScore), or EPI test, may not receive or maintain government or private reimbursement coverage for clinical laboratory testing as planned, which may have a material adverse effect upon the revenue and profits for this product line.
In August 2018, we acquired Exosome Diagnostics, which sells the EPI test, a non-invasive urine test that predicts the aggressiveness of prostate cancer. We are currently seeking coverage decisions regarding reimbursement from both public and private payers. However, the process and timeline for obtaining coverage decisions is uncertain and difficult to predict. Moreover, federal and state government payers, such as Medicare and Medicaid, as well as insurers, including managed care organizations, continue to increase their efforts to control the cost, utilization and delivery of healthcare services. From time to time, Congress considers and implements changes in Medicare fee schedules affecting reimbursement rates in conjunction with budgetary legislation. Further, reimbursement reductions due to changes in policy regarding coverage of tests or other requirements for payment (such as prior authorization, diagnosis code and other claims edits, or a physician or qualified practitioner’s signature on test requisitions) may be implemented from time to time. Still further, changes in third-party payer regulations, policies, or laboratory benefit or utilization management programs, as well as actions by federal and state agencies regulating insurance, including healthcare exchanges, or changes in other laws, regulations, or policies, may have a material adverse effect on revenue and earnings associated with Exosome Diagnostics’ EPI product.
The Company could face significant monetary damages and penalties and/or exclusion from government programs if its Exosome Diagnostics’ EPI business violates federal, state, local or international laws including, but not limited to, anti-fraud and abuse laws.
As a healthcare provider, the Company’s Exosome Diagnostics’ EPI business is subject to extensive regulation at the federal, state, and local levels in the U.S. and other countries where it operates. The Company’s failure to meet governmental requirements under these regulations, including those relating to billing practices and financial relationships with physicians, hospitals, and health systems, could lead to civil and criminal penalties, exclusion from participation in Medicare and Medicaid, and possibly prohibitions or restrictions on the use of its laboratories. While the Company believes that it is in material compliance with all statutory and regulatory requirements, there is a risk that government authorities might take a contrary position. Such occurrences, regardless of their outcome, could damage the Company’s reputation and adversely affect important business relationships it has with third parties.
The Company’s Exosome Diagnostics EPI business could be harmed from the loss or suspension of a license or imposition of a fine or penalties under, or future changes in, or interpretations of, the law or regulations of the Clinical Laboratory Improvement Act of 1967, and the Clinical Laboratory Improvement Amendments of 1988 (CLIA), or those of Medicare, Medicaid or government agencies where the Company operates its laboratory.
The commercial laboratory testing industry is subject to extensive U.S. regulation, and many of these statutes and regulations have not been interpreted by the courts. CLIA extends federal oversight to virtually all clinical laboratories operating in the U.S. by requiring that they be certified by the federal government or by a federally approved accreditation agency. The sanction for failure to comply with CLIA requirements may be suspension, revocation or limitation of a laboratory’s CLIA certificate, which is necessary to conduct business, as well as significant fines and/or criminal penalties. In addition, the Company’s EPI business is subject to regulation under state law. State laws may require that laboratories and/or laboratory personnel meet certain qualifications, specify certain quality controls or require maintenance of certain records. Applicable statutes and regulations could be interpreted or applied by a prosecutorial, regulatory or judicial authority in a manner that would adversely affect the Company's EPI business. Potential sanctions for violation of these statutes and regulations include significant fines and the suspension or loss of various licenses, certificates and authorizations, which could have a material adverse effect on the Company’s EPI business. In addition, compliance with future legislation could impose additional requirements on the Company, which may be costly.
Failure to comply with privacy and security laws and regulations could result in fines, penalties and damage to the Company’s reputation and have a material adverse effect upon the Company’s business, a risk that has been elevated with the acquisition of Exosome Diagnostics, whose laboratory testing service is a healthcare provider that obtains and uses protected health information.
If the Company does not comply with existing or new laws and regulations related to protecting the privacy and security of personal or health information, it could be subject to monetary fines, civil penalties or criminal sanctions. In the U.S., the Health Insurance Portability and Accountability Act of 1996 (HIPAA) privacy and security regulations, including the expanded requirements under U.S. Health Information Technology for Economic and Clinical Health Act (HITECH), establish comprehensive standards with respect to the use and disclosure of protected health information (PHI) by covered entities, in addition to setting standards to protect the confidentiality, integrity and security of PHI. HIPAA restricts the Company’s ability to use or disclose PHI, without patient authorization, for purposes other than payment, treatment or healthcare operations (as defined by HIPAA), except for disclosures for various public policy purposes and other permitted purposes outlined in the privacy regulations. If the laboratory operations for the Company’s EPI business use or disclose PHI improperly under these privacy regulations, they may incur significant fines and other penalties for wrongful use or disclosure of PHI in violation of the privacy and security regulations, including potential civil and criminal fines and penalties
The Company relies heavily on internal manufacturing and related operations to produce, package and distribute its products which, if disrupted, could materially impair our business operations.
The Company's internal quality control, packaging and distribution operations support the majority of the Company's sales. Since certain Company products must comply with Food and Drug Administration Quality System Regulations and because in all instances, the Company creates value for its customers through the development of high-quality products, any significant decline in quality or disruption of operations for any reason, particularly at the Minneapolis facility, could adversely affect sales and customer relationships, and therefore adversely affect the business. While the Company has taken certain steps to manage these operational risks, and while insurance coverage may reimburse, in whole or in part, for losses related to such disruptions, the Company's future sales growth and earnings may be adversely affected by perceived disruption risks or actual disruptions.
Our business could be adversely affected by disruptions at our sites.
We rely upon our manufacturing operations to produce many of the products we sell and our warehouse facilities to store products, pending sale. Any significant disruption of those operations for any reason, such as strikes or other labor unrest, power interruptions, fire, hurricanes or other events beyond our control could adversely affect our sales and customer relationships and therefore adversely affect our business. We have significant operations in California, near major earthquake faults, which make us susceptible to earthquake risk. Although most of our raw materials are available from a number of potential suppliers, our operations also depend upon our ability to obtain raw materials at reasonable prices. If we are unable to obtain the materials we need at a reasonable price, we may not be able to produce certain of our products or we may not be able to produce certain of these products at a marketable price, which could have an adverse effect on our results of operations.
Fluctuations in our effective tax rate may adversely affect our results of operations and cash flows.
As a global company, we are subject to taxation in numerous countries, states and other jurisdictions. In particular, we are affected by the impact of changes to tax laws or related authoritative interpretations in the United States, including tax reform under the Tax Cuts and Jobs Act (the “Tax Act”) signed by the President of the United States on December 22, 2017, which includes broad and complex changes to the United States tax code and the state tax response to the Tax Act. Reasonable estimates were used in determining several of the components of the impact of the Tax Act, including our fiscal 2018 deferred income tax activity and the amount of post-1986 foreign deferred earnings subject to the repatriation toll charge. In addition, certain provisions of the Tax Act including the Base Erosion Anti-abuse Tax (BEAT) and the provision designed to tax currently global intangible low-tax income (GILTI) were effective for the Company in the year beginning July 1, 2018. In addition, the Company anticipates changes in interpretations, assumptions and guidance regarding the Tax Act to be issued by the U.S. Treasury Department, which could have a material impact on our effective tax rate in future periods.
In preparing our financial statements, we record the amount of tax that is payable in each of the countries, states and other jurisdictions in which we operate. Our future effective tax rate, however, may be lower or higher than experienced in the past due to numerous factors, including a change in the mix of our profitability from country to country, changes in accounting for income taxes and recently enacted and future changes in tax laws in jurisdictions in which we operate. Any of these factors could cause us to experience an effective tax rate significantly different from previous periods or our current expectations, which could have an adverse effect on our business, results of operations and cash flows.
Because we rely heavily on third-party package-delivery services, a significant disruption in these services or significant increases in prices may disrupt our ability to ship products, increase our costs and lower our profitability.
We ship a significant portion of our products to our customers through independent package delivery companies, such as FedEx in the U.S. and DHL in Europe. If one or more of these third-party package-delivery providers were to experience a major work stoppage, preventing our products from being delivered in a timely fashion or causing us to incur additional shipping costs we could not pass on to our customers, our costs could increase and our relationships with certain of our customers could be adversely affected. In addition, if one or more of these third-party package-delivery providers were to increase prices, and we were not able to find comparable alternatives or make adjustments in our delivery network, our profitability could be adversely affected.
As a multinational corporation, we are exposed to fluctuations in currency exchange rates, which could adversely affect our cash flows and results of operations.
International markets contribute a substantial portion of our revenues, and we intend to continue expanding our presence in these regions. The exposure to fluctuations in currency exchange rates takes on different forms. International revenues and costs are subject to the risk that fluctuations in exchange rates could adversely affect our reported revenues and profitability when translated into U.S. dollars for financial reporting purposes. These fluctuations could also adversely affect the demand for products and services provided by us. As a multinational corporation, our businesses occasionally invoice third-party customers in currencies other than the one in which they primarily do business (the "functional currency"). Movements in the invoiced currency relative to the functional currency could adversely impact our cash flows and our results of operations. As our international sales grow, exposure to fluctuations in currency exchange rates could have a larger effect on our financial results. In fiscal 2019, currency translation had an unfavorable effect of $9.2 million on revenues due to the strengthening of the U.S. dollar relative to other currencies in which the company sells products and services.
We have entered into and drawn on a revolving credit facility. The burden of this additional debt could adversely affect us, make us more vulnerable to adverse economic or industry conditions, and prevent us from funding our expansion strategy.
In connection with the acquisition of Exosome Diagnostics on August 1, 2018, we used a new credit facility governed by a Credit Agreement entered into on July 28, 2018. The Credit Agreement provides for a revolving credit facility of $600 million, which can be increased by an additional $200 million subject to certain conditions, and a term loan of $250 million. Borrowings under the Credit Agreement bear interest at a variable rate. As of August 22, 2019, the Company had drawn $330 million under the Credit Agreement.
The terms of the Credit Agreement and the burden of the indebtedness incurred thereunder could have negative consequences for us, such as:
|
• |
limiting our ability to obtain additional financing to fund our working capital, capital expenditures, debt service requirements, expansion strategy, or other needs; |
|
|
• |
increasing our vulnerability to, and reducing our flexibility in planning for, adverse changes in economic, industry and competitive conditions; and |
|
• |
increasing our vulnerability to increases in interest rates. |
The Credit Agreement also contains negative covenants that limit our ability to engage in specified types of transactions. These covenants limit our ability to, among other things, sell, lease or transfer any properties or assets, with certain exceptions; and enter into certain merger, consolidation or other reorganization transactions, with certain exceptions.
A breach of any of these covenants could result in an event of default under our credit facility. Upon the occurrence of an event of default, the lender could elect to declare all amounts outstanding under such facility to be immediately due and payable and terminate all commitments to extend further credit. In addition, the Company would be subject to additional restrictions if an event of default exists under the Credit Agreement, such as a prohibition on the payment of cash dividends.
Our share price will fluctuate.
Over the last several years, stock markets in general and our common stock in particular have experienced significant price and volume volatility. Both the market price and the daily trading volume of our common stock may continue to be subject to significant fluctuations due not only to general stock market conditions but also to a change in sentiment in the market regarding our operations and business prospects. In addition to the risk factors discussed above, the price and volume volatility of our common stock may be affected by:
|
• |
operating results that vary from our financial guidance or the expectations of securities analysts and investors; |
|
|
• |
the financial performance of the major end markets that we target; |
|
|
• |
the operating and securities price performance of companies that investors consider to be comparable to us; |
|
|
• |
announcements of strategic developments, acquisitions and other material events by us or our competitors; and |
|
|
• |
changes in global financial markets and global economies and general market conditions, such as interest or foreign exchange rates, commodity and equity prices and the value of financial assets. |
Dividends on our common stock could be reduced or eliminated in the future.
For the past 10 years, our Board has consistently declared quarterly dividends of $0.25 to $0.32 cents per share. In the future, our Board may determine to reduce or eliminate our common stock dividend in order to fund investments for growth, repurchase shares or conserve capital resources.
ITEM 1B. UNRESOLVED STAFF COMMENTS
There are no unresolved staff comments as of the date of this report.
The Company owns the facilities that its headquarters and R&D Systems subsidiary occupy in Minneapolis, Minnesota. The Minneapolis facilities are utilized by both the Company's Protein Sciences and Diagnostics and Genomics segments.
The Minneapolis complex includes approximately 800,000 square feet of space in several adjoining buildings. Bio-Techne uses approximately 625,000 square feet of the complex for administrative, research, manufacturing, shipping and warehousing activities. The Company is currently leasing the remaining space in the complex as retail and office space.
The Company owns a 17,000 square foot facility that its Bio-Techne Europe subsidiary occupies in Abingdon, England. This facility is utilized by the Company's Protein Sciences and Diagnostics and Genomics segments.
Additionally, the Company owns a 34,000 square foot facility that its Atlanta Biologicals subsidiary occupies in Flowery Branch, Georgia. This facility is utilized by the Company’s Protein Sciences.
The Company leases the following material facilities, all of which are primarily utilized by the Company's Protein Sciences segment with the exception of the locations used by the Company's ProteinSimple and CyVek subsidiaries, which support both the Protein Sciences segment and the Diagnostics & Genomics segment). Certain locations are not named because they were not significant individually or in the aggregate as of the date of this report.
|
Subsidiary |
|
Location |
|
Type |
|
Square Feet |
|
|
|
|
|
|
|
|
|
|
|
Bio-Techne Europe |
|
Langley, United Kingdom |
|
Warehouse |
|
14,300 |
|
|
Bio-Techne China |
|
Shanghai and Beijing, China |
|
Office/warehouse |
|
10,700 |
|
|
Boston Biochem |
|
Cambridge, Massachusetts |
|
Office/lab |
|
7,400 |
|
|
Tocris |
|
Bristol, United Kingdom |
|
Office/manufacturing/lab/warehouse |
|
30,000 |
|
|
PrimeGene |
|
Shanghai, China |
|
Office/manufacturing/lab |
|
20,600 |
|
|
Bionostics |
|
Devens, Massachusetts |
|
Office/manufacturing |
|
48,000 |
|
|
Novus Biologicals |
|
Littleton, Colorado |
|
Office/warehouse |
|
22,500 |
|
|
ProteinSimple |
|
San Jose, California |
|
Office/manufacturing/warehouse |
|
167,000 |
|
|
ProteinSimple Canada |
|
Ottawa and Toronto, Canada |
|
Office/manufacturing/warehouse |
|
13,900 |
|
|
CyVek |
|
Wallingford, Connecticut |
|
Office/manufacturing/warehouse |
|
17,500 |
|
|
Cliniqa |
|
San Marcos, California |
|
Office/manufacturing/warehouse |
|
62,200 |
|
|
Advanced Cell Diagnostics |
|
Newark, California |
|
Office/manufacturing/warehouse |
|
46,500 |
|
|
Eurocell Diagnostics |
|
Rennes, France |
|
Office/warehouse |
|
11,000 |
|
| Exosome Diagnostics | Waltham, Massachusetts | Office/manufacturing/warehouse | 28,000 |
The Company believes the owned and leased properties are adequate to meet its occupancy needs in the foreseeable future.
As of August 28, 2019, the Company is not a party to any legal proceedings that, individually or in the aggregate, are reasonably expected to have a material adverse effect on the Company's business, results of operations, financial condition or cash flows.
ITEM 4. MINE SAFETY DISCLOSURES
Not applicable.
ITEM 5. MARKET FOR THE REGISTRANT'S COMMON EQUITY, RELATED SHAREHOLDER
MATTERS AND ISSUER PURCHASES OF EQUITY SECURITIES
Holders of Common Stock and Dividends Paid
As of August 26, 2019, there were over 43,000 beneficial shareholders of the Company's common stock and over 150 shareholders of record. The Company paid annual cash dividends totaling $48.4 million, $48.0 million, and $47.7 million in fiscal 2019, 2018 and 2017, respectively. The Board of Directors periodically considers the payment of cash dividends, and there is no guarantee that the Company will pay comparable cash dividends, or any cash dividends, in the future.
In connection with the acquisition of Exosome Diagnostics, Inc. on August 1, 2018, the Company entered into a new credit facility that provides for a revolving credit facility of $600 million, which can be increased by an additional $200 million subject to certain conditions, and a term loan of $250 million. The credit facility is governed by a Credit Agreement dated August 1, 2018 and matures on August 1, 2023. The Credit Agreement that governs the revolving line of credit contains customary events of default and would prohibit payment of dividends to Company shareholders in the event of a default thereunder.
Issuer Purchases of Equity Securities
The Company repurchased 95,000 shares during fiscal 2019 for $15.4 million at an average share price of $162.15. The Company did not repurchase any shares in fiscal 2018 or 2017. As of June 30, 2018, the maximum approximate dollar value of shares that could have been purchased under the Company's then existing stock repurchase plan was approximately $125 million, with no specified end period. During fiscal 2019, the Board rescinded the existing stock repurchase plan and implemented a new repurchase plan, which grants management the discretion to mitigate the dilutive effect of stock option exercises by authorizing repurchase of shares up to the amount of stock returned to the corporation through stock option exercises of $19.2 million, the dilutive effect of stock option exercises in fiscal 2018, which is then adjusted for the dilutive effect of additional stock option exercises occurring subsequent to June 30, 2018. As of June 30, 2019, we have authorization of approximately $42 million that may yet be used to purchase additional shares under the newly implemented stock repurchase program.
Stock Performance Graph
The following chart compares the cumulative total shareholder return on the Company's common stock with the S&P Midcap 400 Index and the S&P 400 MidCap Life Sciences Tools and Services Index.The comparison assumes $100 was invested on the last trading day before July 1, 2014 in the Company's common stock and in each of the foregoing indices and assumes reinvestment of dividends.
COMPARISON OF 5 YEAR CUMULATIVE TOTAL RETURN*
Among Bio-Techne Corporation, the S&P Midcap 400 Index,
and S&P 400 Mid-Cap Life Sciences Tools and Services Index
|
|
||
| *$100 invested on 6/30/14 in stock or index, including reinvestment of dividends. Fiscal year ending June 30. Copyright© 2019 Standard & Poor's, a division of S&P Global. All rights reserved. |
ITEM 6. SELECTED FINANCIAL DATA
(dollars in thousands, except per share data)
|
Income and Share Data: |
2019(1) | 2018(2) | 2017(3) | 2016(4) | 2015(5) | |||||||||||||||
|
Net sales |
$ | 714,006 | $ | 642,993 | $ | 563,003 | $ | 499,023 | $ | 452,246 | ||||||||||
|
Operating income |
146,719 | 136,178 | 120,584 | 150,593 | 147,023 | |||||||||||||||
|
Earnings before income taxes (6) |
112,015 | 125,952 | 111,961 | 147,481 | 154,162 | |||||||||||||||
|
Net earnings |
96,072 | 126,150 | 76,086 | 104,476 | 107,735 | |||||||||||||||
|
Diluted earnings per share |
2.47 | 3.31 | 2.03 | 2.80 | 2.89 | |||||||||||||||
|
Average common and common equivalent shares - diluted (in thousands) |
38,892 | 38,055 | 37,500 | 37,326 | 37,231 | |||||||||||||||
|
Balance Sheet Data as of June 30: |
2019 |
2018 |
2017 |
2016 |
2015 |
|||||||||||||||
|
Cash, cash equivalents and short-term available-for-sale investments |
$ | 166,033 | $ | 181,754 | $ | 157,714 | $ | 95,835 | $ | 110,921 | ||||||||||
|
Working capital |
310,622 | 318,856 | 212,503 | 199,744 | 208,515 | |||||||||||||||
|
Total assets |
1,884,410 | 1,593,202 | 1,558,219 | 1,129,581 | 1,063,360 | |||||||||||||||
|
Total shareholders' equity |
1,165,589 | 1,079,061 | 949,627 | 879,280 | 846,935 | |||||||||||||||
|
Cash Flow Data: |
2019 |
2018 |
2017 |
2016 |
2015 |
|||||||||||||||
|
Net cash provided by operating activities |
181,619 | $ | 170,367 | $ | 143,721 | $ | 144,157 | $ | 139,359 | |||||||||||
|
Capital expenditures |
25,411 | 20,934 | 15,179 | 16,898 | 19,905 | |||||||||||||||
|
Cash dividends declared per share |
1.28 | 1.28 | 1.28 | 1.28 | 1.27 | |||||||||||||||
|
Employee Data as of June 30: |
2019 |
2018 |
2017 |
2016 |
2015 |
|||||||||||||||
|
Employees |
2,255 | 1,943 | 1,789 | 1,560 | 1,356 | |||||||||||||||
|
(1)
(2) |
The Company acquired Quad Technologies on July 2, 2018, Exosome Diagnostics on August 1, 2018 and B-Mogen on June 4, 2019. The Company acquired Trevigen on September 5, 2017, Atlanta Biologicals on January 2, 2018, and Eurocell Diagnostics on February 1, 2018.
|
|
(3) |
The Company acquired Space on July 1, 2016, and Advanced Cell Diagnostics on August 1, 2016. |
|
(4) |
The Company acquired Cliniqa on July 8, 2015, and Zephyrus on March 21, 2016. |
|
(5) |
The Company acquired Novus Biologicals on July 2, 2014, ProteinSimple on July 31, 2014, and CyVek on November 3, 2014. |
|
(6) |
Earnings before income taxes included acquisition related expenses related to amortization of intangibles, costs recognized on sale of acquired inventories and professional fees associated with acquisition activity, as follows: 2019 - $64.9 million; 2018 - $74.2 million; 2017 - $73.2 million; 2016 - $37.6 million; 2015 - $37.6 million. |
ITEM 7. MANAGEMENT'S DISCUSSION AND ANALYSIS OF FINANCIAL
CONDITION AND RESULTS OF OPERATIONS
The following management discussion and analysis (“MD&A”) provides information that we believe is useful in understanding our operating results, cash flows and financial condition. We provide quantitative information about the material sales drivers including the effect of acquisitions and changes in foreign currency at the corporate and segment level. We also provide quantitative information about discrete tax items and other significant factors we believe are useful for understanding our results. The MD&A should be read in conjunction with the consolidated financial information and related notes included in this Form 10-K. This discussion contains various “Non-GAAP Financial Measures” and also contains various “Forward-Looking Statements” within the meaning of the Private Securities Litigation Reform Act of 1995. We refer readers to the statements entitled “Non-GAAP Financial Measures” located at the end of this MD&A and “Forward-Looking Information and Cautionary Statements” and “Risk Factors” within Items 1 and 1A of this Form 10-K.
OVERVIEW
Bio-Techne develops, manufactures and sells life science reagents, instruments and services for the research and clinical diagnostic markets worldwide. With our deep product portfolio and application expertise, we sell integral components of scientific investigations into biological processes and molecular diagnostics, revealing the nature, diagnosis, etiology and progression of specific diseases. Our products aid in drug discovery efforts and provide the means for accurate clinical tests and diagnoses.
During our fiscal year 2019, we operated with two reporting segments – our Protein Sciences segment and our Diagnostics and Genomics segment. Our Protein Sciences segment is a leading developer and manufacturer of high-quality purified proteins and reagent solutions, most notably cytokines and growth factors, antibodies, immunoassays, biologically active small molecule compounds, tissue culture reagents and T-Cell activation technologies. This segment also includes protein analysis solutions that offer researchers efficient and streamlined options for automated western blot and multiplexed ELISA workflow. Our Genomics and Diagnostics segment develops and manufactures diagnostic products, including FDA-regulated controls, calibrators, blood gas and clinical chemistry controls and other reagents for OEM and clinical customers, as well as a portfolio of clinical molecular diagnostic oncology assays, including the ExoDx®Prostate(IntelliScore) test (EPI) for prostate cancer diagnosis. This segment also manufactures and sells advanced tissue-based in-situ hybridization assays (ISH) for research and clinical use.
OVERALL RESULTS
For fiscal 2019, consolidated net sales increased 11% as compared to fiscal 2018. Organic growth for the year was 10% with currency translation having an unfavorable impact of 1% and acquisitions contributing 2%. The organic growth was broad-based with double digit organic growth in the United States, high single digit organic growth in Europe, and over 25% organic growth in China.
Consolidated GAAP net earnings decreased 24% for fiscal 2019 as compared to fiscal 2018. After adjusting for acquisition related costs, stock-based compensation, and certain income tax items in both years, adjusted net earnings increased 2% in fiscal 2019 as compared to fiscal 2018. Adjusted earnings growth was driven by volume leverage, which was partially offset by negative margin acquisitions.
For fiscal 2018, consolidated net sales increased 14% as compared to fiscal 2017. Organic sales for the year increased 9% with currency translation contributing 2% and acquisitions contributing 3%. The organic growth was broad-based as the Company achieved high-single digit growth in the US with contributions from both the Academic and Bio-Pharma end-markets. Europe sales grew in the mid-teens with growth in both the Academic and Bio-Pharma end-markets. China sales grew nearly 25% and Japan sales grew in the mid-teens while the rest of the Asia-Pacific region grew in the high-teens.
Consolidated GAAP net earnings increased 65% for fiscal 2018 as compared to fiscal 2017. After adjusting for acquisition related costs, stock-based compensation, and certain income tax items in both years, adjusted net earnings increased 24% in fiscal 2018 as compared to fiscal 2017. Adjusted earnings growth was driven by strong volume leverage and the benefit from tax reform, which was partially offset by negative business mix, lower margin acquisitions, and investments in global commercial resources and administrative infrastructure.
RESULTS OF OPERATIONS
Net Sales
Consolidated organic net sales exclude the impact of net sales contributed by companies acquired during the fiscal year and the effect of the change from the prior year in exchange rates used to convert sales in foreign currencies (primarily the euro, British pound sterling, and Chinese yuan) into U.S. dollars.
Consolidated net sales growth was as follows:
|
Year Ended June 30, |
||||||||||||
|
2019 |
2018 |
2017 |
||||||||||
|
Organic sales growth |
10 |
% |
9 |
% |
6 |
% |
||||||
|
Acquisitions sales growth |
2 |
% |
3 |
% |
8 |
% |
||||||
|
Impact of foreign currency fluctuations |
(1 |
)% |
2 |
% |
(1 |
)% |
||||||
|
Consolidated net sales growth |
11 |
% |
14 |
% |
13 |
% |
||||||
Consolidated net sales by reportable segment were as follows (in thousands):
|
Year Ended June 30, |
||||||||||||
|
2019 |
2018 |
2017 |
||||||||||
|
Protein Sciences |
$ | 543,159 | $ | 482,378 | $ | 419,365 | ||||||
|
Diagnostics and Genomics |
171,674 | 161,151 | 143,742 | |||||||||
|
Intersegment |
(827 | ) | (536 |
) |
(104 |
) |
||||||
|
Consolidated net sales |
$ | 714,006 | $ | 642,993 | $ | 563,003 | ||||||
In fiscal 2019, Protein Sciences segment net sales increased 13% compared to fiscal 2018. Organic growth for the segment was 13% for the fiscal year, with acquisitions contributing 2% and foreign currency translation having an unfavorable impact of 2%. Growth was broad-based and especially strong in the antibodies and cell therapy consumables as well as the Simple Western and Simple Plex instrument product categories.
In fiscal 2019, the Diagnostics and Genomics segment net sales increased 7% compared to fiscal 2018. Organic growth for the segment was 4% with acquisitions contributing 3%. Growth in this segment was primarily driven by strong RNAscope product sales.
In fiscal 2018, Protein Sciences segment net sales increased 15% compared to fiscal 2017. Organic growth for the segment was 10% for the fiscal year, with acquisitions contributing 2% and foreign currency translation contributing 3%. Antibody and assay product categories drove growth. The growth in antibodies was led by double-digit growth in the Novus brand. The growth in assays was led by Luminex-based products the Company makes and sells and royalties received from Luminex assay suppliers who use the Company’s content in the production of their assays.
In fiscal 2018, Diagnostics & Genomics segment net sales increased 12% compared to fiscal 2017. Organic growth was 9% with acquisitions and foreign currency impacting revenue by 2% and 1%, respectively.
Gross Margins
Consolidated gross margins were 66.3%, 67.2%, and 66.5% in fiscal 2019, 2018 and 2017, respectively. Consolidated gross margins were negatively impacted as a result of purchase accounting related to inventory and intangible assets acquired during fiscal 2019, 2018, 2017 and prior years. Under purchase accounting, inventory is valued at fair value less expected selling and marketing costs, resulting in reduced margins in future periods as the inventory is sold. Excluding the impact of acquired inventory sold and amortization of intangibles, adjusted gross margins were 71.5%, 71.5%, and 71.2% in fiscal 2019, 2018 and 2017, respectively.
A reconciliation of the reported consolidated gross margin percentages, adjusted for acquired inventory sold and intangible amortization included in cost of sales, is as follows:
|
Year Ended June 30, |
||||||||||||
|
2019 |
2018 |
2017 |
||||||||||
|
Consolidated gross margin percentage |
66.3 |
% |
67.2 |
% |
66.5 |
% |
||||||
|
Identified adjustments: |
||||||||||||
|
Costs recognized upon sale of acquired inventory |
0.5 |
% |
0.4 |
% |
0.6 |
% |
||||||
|
Amortization of intangibles |
4.7 |
% |
3.9 |
% |
4.1 |
% |
||||||
|
Non-GAAP adjusted gross margin percentage |
71.5 |
% |
71.5 |
% |
71.2 |
% |
||||||
Fluctuations in adjusted gross margins, as a percentage of net sales, have primarily resulted from changes in foreign currency exchange rates and changes in product mix. We expect that, in the future, gross margins will continue to be impacted by the mix of our portfolio growing at different rates as well as future acquisitions.
Management uses adjusted operating results to monitor and evaluate performance of the Company’s two segments. Since these results are used for this purpose, they are also considered to be prepared in accordance with GAAP. Segment gross margins, as a percentage of net sales, were as follows:
|
Year Ended June 30, |
||||||||||||
|
2019 |
2018 |
2017 |
||||||||||
|
Protein Sciences |
73.9 |
% |
74.1 |
% |
75.4 |
% |
||||||
|
Diagnostics and Genomics |
41.8 |
% |
46.3 |
% |
40.6 |
% |
||||||
The small decrease in the Protein Sciences segment’s gross margin percentage for fiscal 2019 was primarily attributable to mix of product sales made in this segment. The decrease in the Diagnostics and Genomics gross margin percentages for fiscal 2019 as compared to fiscal 2018 were due to negative gross margins for acquisitions made in the segment, namely ExosomeDx.
The Protein Sciences segment decrease for fiscal 2018 as compared to fiscal 2017 was primarily attributable to mix of product sales made in this segment. The Diagnostics and Genomics segment gross margin percentages for fiscal 2018 as compared to fiscal 2017 were positively impacted by higher volume leverage and operational productivity.
Selling, General and Administrative Expenses
Selling, general and administrative expenses increased $23.7 million (10%) and $40.2 million (20%) in fiscal 2019 and 2018, respectively.
The increase in fiscal 2019 was primarily driven by an additional cost base from our fiscal 2019 acquisitions, additional stock-based compensation expense, and additional amortization expense associated with intangible assets recorded from our fiscal 2019 acquisitions. These increases were partially offset by a reduction in acquisition related expenses.
The increase in fiscal 2018 was driven by additional investments in global commercial resources and administrative infrastructure, a larger cost base due to acquisitions and $13.6 million of additional stock-based compensation expense of which $8.3 million is from a new retirement policy that permits retirees to continue vesting in certain time-based stock options granted during employment, resulting in accelerated stock compensation expense for those employees meeting the definition of retirement eligible.
Consolidated selling, general and administrative expenses were composed of the following (in thousands):
|
Year Ended June 30, |
||||||||||||
|
2019 |
2018 |
2017 |
||||||||||
|
Protein Sciences |
$ | 135,513 | $ | 119,649 | $ | 100,881 | ||||||
|
Diagnostics and Genomics |
61,646 | 40,255 | 32,862 | |||||||||
|
Total segment expenses |
197,159 | 159,904 | 133,743 | |||||||||
|
Amortization of intangibles |
25,210 | 21,650 | 21,328 | |||||||||
|
Acquisition related expenses |
2,282 | 24,429 | 25,789 | |||||||||
|
Restructuring costs |
- | 376 | - | |||||||||
|
Stock-based compensation |
33,057 | 28,240 | 14,631 | |||||||||
|
Corporate selling, general and administrative expenses |
6,651 | 6,037 | 4,952 | |||||||||
|
Total selling, general and administrative expenses |
$ | 264,359 | $ | 240,636 | $ | 200,443 | ||||||
Research and Development Expenses
Research and development expenses increased $7.1 million (13%) and $1.8 million (3%) in fiscal 2019 and 2018, respectively, as compared to prior year periods. The increase in research and development expense in fiscal 2019 as compared to fiscal 2018 was primarily attributable to our ExosomeDx acquisition. The increase in research and development from 2018 as compared to fiscal 2017 was primarily attributable to additional expenses from our 2017 acquisition, Advanced Cell Diagnostics.
|
Year Ended June 30, |
||||||||||||
|
2019 |
2018 |
2017 |
||||||||||
|
Protein Sciences |
$ | 40,735 | $ | 40,996 | $ | 41,334 | ||||||
|
Diagnostics and Genomics |
21,678 | 14,095 | 12,180 | |||||||||
|
Total segment expenses |
62,413 | 55,091 | 53,514 | |||||||||
|
Unallocated corporate expenses |
- | 238 | - | |||||||||
|
Total research and development expenses |
$ | 62,413 | $ | 55,329 | $ | 53,514 | ||||||
Net Interest Income / (Expense)
Net interest income/(expense) for fiscal 2019, 2018 and 2017 was $(21.1) million, $(9.8) million, and $(7.1) million respectively. Net interest expense in fiscal 2019 increased due to a change in our average long-term debt outstanding for fiscal 2019. Net interest expense in fiscal 2018 increased due to changes in interest rates.
Other Non-Operating Expense, Net
Other non-operating expense, net, consists of foreign currency transaction gains and losses, rental income, building expenses related to rental property and the Company's gains and losses on investments as follows (in thousands):
|
Year Ended June 30, |
||||||||||||
|
2019 |
2018 |
2017 |
||||||||||
|
Foreign currency (losses) gains |
$ | (455 | ) | $ | (227 |
) |
$ | (636 |
) |
|||
|
Rental income |
1,141 | 1,177 | 947 | |||||||||
|
Real estate taxes, depreciation and utilities |
(1,897 | ) | (1,803 |
) |
(1,818 |
) |
||||||
|
Gain (loss) on investment |
(12,370 | ) | 397 | - | ||||||||
|
Miscellaneous (expense) income |
13 | 9 |
|
(59 | ) | |||||||
|
Other non-operating income (expense), net |
$ | (13,568 | ) | $ | (447 |
) |
$ | (1,566 |
) |
|||
During fiscal 2019, the company recognized losses of $16.1 million related to unrealized changes in fair value related to changes in the stock price of our ChemoCentryx, Inc. (CCXI) investment, which were partially offset by a $3.7 million gain realized upon acquisition from our historical investment in B-MoGen.
During the third quarter of fiscal 2018, the Company recognized a $16.2 million impairment on the write-down of its investment in Astute Medical, Inc. (Astute) in anticipation of the amount of cash to be received upon completion of the sale of Astute to a third party. The Astute sale closed in the fourth quarter of fiscal 2018 at the anticipated amount. This loss was offset by a $16.1 million gain on the sale of a portion of the Company’s investment in ChemoCentryx, Inc. (CCXI) and a $0.5 million gain on the sale of investment property in the fourth quarter of fiscal 2018. These gains and losses are included in other income (expense) in the accompanying Consolidated Statements of Earnings and Comprehensive Income.
Income Taxes
Income taxes for fiscal 2019, 2018 and 2017 were at effective rates of 14.2%, (0.2)%, and 32.0%, respectively, of consolidated earnings before income taxes. The change in the effective tax rate was driven by discrete tax items. The Company's discrete tax benefits in fiscal 2019 primarily related to share-based compensation excess tax benefits of $7.2 million, $3.2 million related to deductible acquisition payments made to employees and third parties, and 2.0 million for tax refunds relating to certain state apportionments. In fiscal 2018, the Company recognized net discrete tax benefits of $34.4 million. The primary driver in fiscal 2018 discrete tax benefits was a discrete net tax benefit of $33.0 million related to the Tax Act (as described in Note 11). Also impacting the Company’s fiscal 2018 effective tax rate was a $2.2 million tax benefit related to share-based compensation excess tax benefits offset by a net discrete tax expense of $4.2 million related to the revaluation of contingent consideration, which is not a tax deductible expense.
The Company's effective income tax rate was (0.2%) in fiscal 2018 compared to 32.0% in fiscal 2017. The decrease in the Company’s tax rate for fiscal 2018 was due to the impact of discrete items which were $33.6 million in fiscal 2018 compared to $3.9 million in fiscal 2018. The primary driver of discrete items was the net tax benefit of $33.0 million related to the Tax Act discussed above recorded in fiscal 2018.
Net Earnings
Non-GAAP adjusted consolidated net earnings are as follows (in thousands):
|
Year Ended June 30, |
||||||||||||
|
2019 |
2018 |
2017 |
||||||||||
|
Net earnings |
$ | 96,072 | $ | 126,150 | $ | 76,086 | ||||||
|
Identified adjustments: |
||||||||||||
|
Costs recognized upon sale of acquired inventory |
3,739 | 2,455 | 3,037 | |||||||||
|
Amortization of intangibles |
58,550 | 46,983 | 44,393 | |||||||||
|
Acquisition related expenses |
2,656 | 24,774 | 25,789 | |||||||||
|
Restructuring costs |
376 | - | ||||||||||
|
Stock-based compensation |
33,057 | 28,240 | 14,631 | |||||||||
|
Gain (loss) on investment |
12,370 |
|
(397 | ) | - | |||||||
|
Tax impact of above adjustments |
(18,323 |
) |
(21,625 |
) |
(20,483 |
) |
||||||
|
Tax impact of discrete tax items and other foreign adjustments |
(12,665 |
) |
(34,360 |
) |
(3,920 |
) |
||||||
|
Non-GAAP adjusted net earnings |
$ | 175,456 | $ | 172,596 | $ | 139,533 | ||||||
|
Non-GAAP adjusted net earnings growth |
2 |
% |
24 |
% |
4 |
% |
||||||
Depending on the nature of discrete tax items, our reported tax rate may not be consistent on a period to period basis. The Company independently calculates a non-GAAP adjusted tax rate considering the impact of discrete items and jurisdictional mix of the identified non-GAAP adjustments. The following table summarizes the reported GAAP tax rate and the effective Non-GAAP adjusted tax rate for the periods ended June 30, 2019, 2018, and 2017.
|
Year Ended June 30, |
||||||||||||
|
2019 |
2018 |
2017 |
||||||||||
|
Reported GAAP tax rate |
14.2 |
% |
(0.2 |
)% |
32.0 |
% |
||||||
|
Tax rate impact of: |
||||||||||||
|
Identified non-GAAP adjustments |
(4.3 | ) | (2.7 |
) |
(3.8 |
) |
||||||
|
Discrete tax items |
11.2 | 27.3 | 2.0 | |||||||||
|
Non-GAAP adjusted tax rate |
21.1 |
% |
24.4 |
% |
30.2 |
% |
||||||
The difference between the reported GAAP tax rate and non-GAAP tax rate applied to the identified non-GAAP adjustments for the fiscal years ended June 30, 2019 is primarily a result of discrete tax items. Refer to Note 11 for additional discussion relating to the change in discrete tax items between fiscal 2019 and fiscal 2018.
The difference between the reported GAAP tax rate and non-GAAP tax rate applied to the identified non-GAAP adjustments for the fiscal years ended June 30, 2018 is due primarily to recording the items attributable to the new tax legislation in the U.S. which resulted in a $33.0 million tax benefit. Offsetting this benefit is the impact of the revaluation of contingent consideration which is not tax deductible. For the fiscal year ended June 30, 2018, the Company recorded acquisition related expense of $20.1 million related to the change in fair value of contingent consideration.
LIQUIDITY AND CAPITAL RESOURCES
Cash, cash equivalents and available-for-sale investments at June 30, 2019 were $166.0 million compared to $181.8 million at June 30, 2018. Included in available-for-sale investments at June 30, 2019 and June 30, 2018 was the fair value of the Company's investment in CCXI of $38.2 million and $54.3 million, respectively.
At June 30, 2019, approximately 34% of the Company's cash and equivalent account balances of $100.9 million were located in the U.S., with the remainder located in primarily in Canada, China, the U.K. and other European countries.
At June 30, 2019, approximately 59% of the Company's available-for-sale investment account balances of $65.1 million were located in the U.S., with the remaining 41% in China.
The Company has either paid U.S. taxes on its undistributed foreign earnings or intends to indefinitely reinvest the undistributed earnings in the foreign operations or expects the earnings will be remitted in a tax neutral transaction. Management of the Company expects to be able to meet its cash and working capital requirements for operations, facility expansion, capital additions, and cash dividends for the foreseeable future, and at least the next 12 months, through currently available funds, including funds available through our line-of-credit and cash generated from operations.
During fiscal 2019, the Company acquired QT Holdings Corporation (Quad), Exosome Diagnostics, Inc. (Exosome), and the outstanding shares of our B-MoGen investment for approximately $20 million plus $51 million in potential contingent consideration, approximately $250 million plus $325 million in potential contingent consideration, and $17 million plus $38 million in potential contingent consideration, respectively. In connection with the acquisition of Exosome Diagnostics on August 1, 2018, the Company entered into a new credit facility governed by a Credit Agreement entered into on August 1, 2018 that matures on August 1, 2023. The Credit Agreement provides for a revolving credit facility of $600 million, which can be increased by an additional $200 million subject to certain conditions, and a term loan of $250 million. Borrowings under the Credit Agreement bear interest at a variable rate.
During fiscal 2018, the Company acquired Trevigen, Atlanta Biologicals and Eurocell Diagnostics for approximately $10.6 million, $51.3 million and $7.3 million, respectively. The acquisitions were financed through a combination of cash on hand and our revolving line of credit facility.
During fiscal 2017, the Company acquired Space and ACD for approximately $9.0 million and $258.0 million, respectively. The acquisitions were financed through a combination of cash on hand and our revolving line of credit facility that the Company obtained prior to the closing of the ACD acquisition. The ACD acquisition also included certain future contingent payments of up to $75.0 million due upon the achievement of certain revenue milestones. Additionally, the Company made a $40.0 million equity investment in Astute Medical, Inc.
Future acquisition strategies may or may not require additional borrowings under the line-of-credit facility or other outside sources of funding.
Cash Flows From Operating Activities
The Company generated cash from operations of $181.6 million, $170.4 million, $143.7 million in fiscal 2019, 2018 and 2017, respectively. The increase in cash generated from operating activities in fiscal 2019 as compared to fiscal 2018 was mainly the result of higher depreciation and amortization and adjustments to available-for-sale securities included with our GAAP earnings, partially offset by a reduction in GAAP earnings. The increase in cash generated from operating activities in fiscal 2018 as compared to fiscal 2017 was mainly the result of higher earnings and decreases in operating assets.
Cash Flows From Investing Activities
We continue to make investments in our business, including capital expenditures. Net cash paid for acquisitions of Quad, Exosome, and B-MoGen was $289.5 million in fiscal 2019, a substantial increase from the net cash paid of $67.9 million for the Trevigen, Atlanta Biologicals and Eurocell Diagnostics acquisitions in fiscal 2018. The Company paid net cash of $253.8 million for the ACD and Space acquisitions in fiscal 2017.
The Company's net proceeds (outflow) from the purchase, sale and maturity of available-for-sale investments in fiscal 2019, 2018, and 2017 were ($21.9 million), $27.8 million, $3.0 million, respectively. The decrease in fiscal 2019 as compared to fiscal 2018 was driven by the sale of a portion of the Company’s investment in CCXI in fiscal 2018 and additional purchases of bonds in fiscal 2019. The Company's investment policy is to place excess cash in municipal and corporate bonds with the objective of obtaining the highest possible return while minimizing risk and keeping the funds accessible.
Capital additions in fiscal year 2019, 2018, and 2017 were $25.4 million, $20.9 million, $15.2 million. Capital additions planned for fiscal 2020 are approximately $56 million and are expected to be financed through currently available cash and cash generated from operations.
Cash Flows From Financing Activities
In fiscal 2019, 2018, and 2017, the Company paid cash dividends of $48.4 million, $48.0 million, $47.3 million, respectively. The Board of Directors periodically considers the payment of cash dividends.
The Company received $38.0 million, $19.2 million, $5.3 million, for the exercise of options for 382,000, 204,000, 63,000 shares of common stock in fiscal 2019, 2018 and 2017, respectively.
During fiscal 2019, the Company drew $580.0 million under its revolving line-of-credit facility to fund its acquisition of Quad, Exosome, and B-MoGen and made repayments on its line-of-credit of $413.5 million.
During fiscal 2018, the Company drew $55.0 million under its revolving line-of-credit facility to fund its acquisition of Atlanta Biologicals and made repayments on its line-of-credit of $59.5 million.
During fiscal 2017, the Company drew $368.5 million under its revolving line-of-credit facility to partially fund its acquisition of ACD and investment in Astute. The Company made payments on the line-of-credit and other debt of $116.5 million
During fiscal 2019, the Company made no cash payments towards the Quad, Exosome, and B-MoGen contingent consideration liabilities.
During fiscal 2018, the Company made $88.5 million ($50 million for ACD, $35 million for CyVek, and $3.5 million for Zephyrus) in cash payments towards the ACD, CyVek and Zephyrus contingent consideration liabilities. Of the $88.5 million in total payments, $61.9 million is classified as financing on the statement of cash flows. The remaining $26.6 million is recorded as operating on the statement of cash flows as it represents the consideration liability that exceeds the amount of the contingent consideration liability recognized at the acquisition date.
In accordance with the terms of the purchase agreement, during fiscal 2019, the Company made the final payment of $1.4 million related to Eurocell. In accordance with the terms of the purchase agreement, during the first quarter of fiscal 2018, the Company made the final $2.3 million payment for the Space acquisition. These payments were included within other financing activities.
During fiscal 2019, the Company repurchased $15.4 million in share repurchases included as a cash outflow within Financing Activities. The Company did not repurchase any shares in fiscal 2018 or 2017.
OFF-BALANCE SHEET ARRANGEMENTS
The Company is not a party to any off-balance sheet transactions, arrangements or obligations that have, or are reasonably likely to have, a current or future material effect on the Company's financial condition, changes in the financial condition, revenues or expenses, results of operations, liquidity, capital expenditures or capital resources.
CONTRACTUAL OBLIGATIONS
The following table summarizes the Company's contractual obligations and commercial commitments as of June 30, 2019 (in thousands):
|
Payments Due by Period |
||||||||||||||||||||
|
Total |
Less than |
1-2 |
3-4 |
After |
||||||||||||||||
|
Long-term debt |
$ | 505,160 | 12,500 | 25,000 | 467,660 | - | ||||||||||||||
|
Lease obligations |
$ | 116,333 | $ | 13,707 | $ | 26,623 | $ | 24,108 | $ | 51,895 | ||||||||||
|
Total contractual obligations |
$ | 621,493 | $ | 26,207 | $ | 51,623 | $ | 491,768 | $ | 51,895 | ||||||||||
The interest rate on the Company's long-term debt is calculated as the sum of LIBOR plus an applicable margin. The Company's estimated net tax expense for fiscal 2020 is approximately $23 million. The applicable margin is determined for the total leverage ratio of the Company and updated on a quarterly basis. Additionally, there is an annualized fee for any unused portion of the credit facility is currently 20 basis points as further described in Note 6.
CRITICAL ACCOUNTING POLICIES
Management's discussion and analysis of the Company's financial condition and results of operations are based upon the Company's Consolidated Financial Statements, which have been prepared in accordance with accounting principles generally accepted in the United States of America (U.S. GAAP). The preparation of these financial statements requires management to make estimates and judgments that affect the reported amounts of assets, liabilities, revenues and expenses, and related disclosure of contingent assets and liabilities. On an ongoing basis, management evaluates its estimates. Management bases its estimates on historical experience and on various other assumptions that are believed to be reasonable under the circumstances, the results of which form the basis for making judgments about the carrying values of assets and liabilities that are not readily apparent from other sources. Actual results may differ from these estimates under different assumptions or conditions.
The Company has identified the policies outlined below as critical to its business operations and an understanding of results of operations. The listing is not intended to be a comprehensive list of all accounting policies; investors should also refer to Note 1 to the Consolidated Financial Statements included in Item 8 of this Annual Report on Form 10-K.
Business Combinations
We allocate the purchase price of acquired businesses to the estimated fair values of the assets acquired and liabilities assumed as of the date of the acquisition. The calculations used to determine the fair value of the long-lived assets acquired, primarily intangible assets, can be complex and require significant judgment. We weigh many factors when completing these estimates including, but not limited to, the nature of the acquired company’s business; its competitive position, strengths, and challenges; its historical financial position and performance; estimated customer retention rates; discount rates; and future plans for the combined entity. We may also engage independent valuation specialists, when necessary, to assist in the fair value calculations for significant acquired long-lived assets.
The fair value of acquired technology is generally the primary asset identified and therefore estimated using the multi-period excess earnings method. The multi-period excess earnings method model estimates revenues and cash flows derived from the primary asset and then deducts portions of the cash flow that can be attributed to supporting assets, such as Trade Names, that contributed to the generation of the cash flows. The resulting cash flow, which is attributable solely to the primary asset acquired, is then discounted at a rate of return commensurate with the risk of the asset to calculate a present value. The Trade Name is generally calculated using the relief from royalty method, which calculates the cost savings associated with owning rather than licensing the technology. Assumed royalty rates are applied to the projected revenues for the remaining useful life of the technology to estimate the royalty savings. In circumstances that Customer Relationship assets are identified that are not the primary asset, they are valued using the distributor model income approach, which isolates revenues and cash flow associated with the sales and distribution function of the entity and attributable to customer-related assets, which are then discounted at a rate of return commensurate with the risk of the asset to calculate a present value.
We estimate the fair value of liabilities for contingent consideration by discounting to present value the probability weighted contingent payments expected to be made. For potential payments related to financial performance based milestones, projected revenue and/or EBITDA amounts, volatility and discount rates assumptions are included in the estimated amounts. For potential payments related to product development milestones, the fair value is based on the probability of achievement of such milestones. The excess of the purchase price over the estimated fair value of the net assets acquired is recorded as goodwill. Goodwill is not amortized, but is subject to impairment testing on at least an annual basis.
We are also required to estimate the useful lives of the acquired intangible assets, which determines the amount of acquisition-related amortization expense we will record in future periods. Each reporting period, we evaluate the remaining useful lives of our amortizable intangibles to determine whether events or circumstances warrant a revision to the remaining period of amortization.
While we use our best estimates and assumptions, our fair value estimates are inherently uncertain and subject to refinement. As a result, during the measurement period, which may be up to one year from the acquisition date, we may record adjustments to the assets acquired and liabilities assumed, with the corresponding offset to goodwill. Any adjustments required after the measurement period are recorded in the consolidated statements of earnings.
The judgments required in determining the estimated fair values and expected useful lives assigned to each class of assets and liabilities acquired can significantly affect net income. For example, different classes of assets will have useful lives that differ. Consequently, to the extent a longer-lived asset is ascribed greater value than a shorter-lived asset, net income in a given period may be higher. Additionally, assigning a lower value to amortizable intangibles would result in a higher amount assigned to goodwill. As goodwill is not amortized, this would benefit net income in a given period, although goodwill is subject to annual impairment analysis.
Impairment of Goodwill
Goodwill
Goodwill was $732 million as of June 30, 2019, which represented 38.9% of total assets. Goodwill is tested for impairment on an annual basis in the fourth quarter of each year, or more frequently if events occur or circumstances change that could indicate a possible impairment.
To analyze goodwill for impairment, we must assign our goodwill to individual reporting units. Identification of reporting units includes an analysis of the components that comprise each of our operating segments, which considers, among other things, the manner in which we operate our business and the availability of discrete financial information. Components of an operating segment are aggregated to form one reporting unit if the components have similar economic characteristics. We periodically review our reporting units to ensure that they continue to reflect the manner in which we operate our business.
2019 Goodwill Impairment Analyses
At the beginning of the quarter ended March 31, 2019, the Company realigned the management of certain business processes between reporting units within the same reportable segment. A goodwill allocation was performed between the impacted reporting units based on the relative fair value of the processes realigned. In conjunction with the realignment, a quantitative goodwill impairment assessment was performed both prior to and subsequent to the realignment. The quantitative assessment indicated that all of the impacted reporting units had substantial headroom both prior to and subsequent to the realignment.
Because our quantitative analysis performed as of January 1, 2019 included all of our reporting units, except for our recent acquisition, Exosome, which is a separate reporting unit that was not impacted by the business process realignment, the summation of the calculated reporting units’ fair values combined with the fair value of the Exosome acquisition, was compared to our consolidated fair value, as indicated by our market capitalization, to evaluate the reasonableness of our calculations.
The quantitative assessments completed as of January 1, 2019 indicated that all tested reporting units had a substantial amount of headroom. Changes in the reporting unit’s results, forecast assumptions and estimates could materially affect the estimation of the fair value of the reporting units.
The Company has elected April 1 as our annual goodwill impairment date for the Exosome reporting unit. The Company has historically completed our goodwill impairment assessment of our legacy reporting units as of June 30. To better align with our annual internal planning and operating cycle and the underlying changes in our organizational model and business, we changed our annual goodwill impairment assessment as of April 1. Given the substantial headroom in our legacy reporting units and the time period the assessment was performed relative to the most recent quantitative analysis, management does not consider the change in our annual impairment assessment to be material to the consolidated financial statements or to constitute a material change in the application of our goodwill accounting principle.
In conducting our annual goodwill impairment test, we elected to perform a qualitative assessment to determine whether changes in events or circumstances since our most recent quantitative test for goodwill impairment indicated that it is more likely than not that the fair value of a reporting unit is less than its carrying amount.
Based on its annual analysis, the Company determined there was no indication of impairment of goodwill. Further, no triggering events or items beyond the realignment discussed above were identified in the year ended June 30, 2019 that would require an additional goodwill impairment assessment beyond our required annual goodwill impairment assessment.
2018 and 2017 Goodwill Impairment Analyses
In completing our 2018 and 2017 annual goodwill impairment analyses, we elected to perform a quantitative assessment for all of our reporting units. A quantitative assessment involves comparing the carrying value of the reporting unit, including goodwill, to its estimated fair value. Carrying value is based on the assets and liabilities associated with the operations of the reporting unit, which often requires the allocation of shared or corporate items among reporting units. In accordance with ASU 2017-04, a goodwill impairment charge is recorded for the amount by which the carrying value of a reporting unit exceeds the fair value of the reporting unit. In determining the fair values of our reporting units, we utilized the income approach. The income approach is a valuation technique under which we estimated future cash flows using the reporting unit's financial forecast from the perspective of an unrelated market participant. Using historical trending and internal forecasting techniques, we projected revenue and applied our fixed and variable cost experience rates to the projected revenue to arrive at the future cash flows. A terminal value was then applied to the projected cash flow stream. Future estimated cash flows were discounted to their present value to calculate the estimated fair value. The discount rate used was the value-weighted average of our estimated cost of capital derived using both known and estimated customary market metrics. In determining the estimated fair value of a reporting unit, we were required to estimate a number of factors, including projected operating results, terminal growth rates, economic conditions, anticipated future cash flows, the discount rate and the allocation of shared or corporate items.
Because our 2018 and 2017 quantitative analyses included all of our reporting units, the summation of our reporting units' fair values was compared to our consolidated fair value, as indicated by our market capitalization, to evaluate the reasonableness of our calculations.
The quantitative assessment completed as of June 30, 2018 and 2017 indicated that all of the reporting units had a substantial amount of headroom. This impairment assessment is sensitive to changes in forecasted cash flows, as well as our selected discount rate. Changes in the reporting unit's results, forecast assumptions and estimates could materially affect the estimation of the fair value of the reporting units.
There has been no impairment of goodwill since the adoption of Financial Accounting Standards Board (“FASB”) ASC 350 guidance for goodwill and other intangibles on July 1, 2002.
NEW ACCOUNTING PRONOUNCEMENTS
Information regarding the accounting policies adopted during fiscal 2018 and those not yet adopted can be found under caption “Note 1: Description of Business and Summary of Significant Accounting Policies” of the Notes to the Consolidated Financial Statements appear in Item 8 of this report.
SUBSEQUENT EVENTS
None
NON-GAAP FINANCIAL MEASURES
This Annual Report on Form 10-K, including “Management’s Discussion and Analysis of Financial Condition and Results of Operations” in Item 7, contains financial measures that have not been calculated in accordance with accounting principles generally accepted in the U.S. (GAAP). These non-GAAP measures include:
| ● | Organic growth |
|
● |
Adjusted gross margin |
|
● |
Adjusted net earnings |
|
● |
Adjusted net earnings growth |
|
● |
Adjusted effective tax rate |
We provide these measures as additional information regarding our operating results. We use these non-GAAP measures internally to evaluate our performance and in making financial and operational decisions, including with respect to incentive compensation. We believe that our presentation of these measures provides investors with greater transparency with respect to our results of operations and that these measures are useful for period-to-period comparison of results.
Our non-GAAP financial measure of organic growth represents revenue growth excluding revenue from acquisitions within the preceeding 12 months as well as the impact of foreign currency. Excluding these measures provides more useful period-to-period comparison of revenue results as it excludes the impact of foreign currency exchange rates, which can vary significantly from period to period, and revenue from acquisitions that would not be included in the comparable prior period.
Our non-GAAP financial measures for adjusted gross margin, adjusted operating margin, and adjusted net earnings, in total and on a per share basis, exclude the costs recognized upon the sale of acquired inventory, amortization of acquisition intangibles, and acquisition related expenses. The Company excludes amortization of purchased intangible assets and purchase accounting adjustments, including costs recognized upon the sale of acquired inventory and acquisition-related expenses, from this measure because they occur as a result of specific events, and are not reflective of our internal investments, the costs of developing, producing, supporting and selling our products, and the other ongoing costs to support our operating structure. Additionally, these amounts can vary significantly from period to period based on current activity.
The Company’s non-GAAP adjusted operating margin and adjusted net earnings, in total and on a per share basis, also excludes stock-based compensation expense, which is inclusive of the employer portion of payroll taxes on those stock awards, restructuring, impairments of equity method investments, gain and losses from investments, and certain adjustments to income tax expense. Stock-based compensation is excluded from non-GAAP adjusted net earnings because of the nature of this charge, specifically the varying available valuation methodologies, subjective assumptions, variety of award types, and unpredictability of amount and timing of employer related tax obligations. Impairments of equity investments are excluded as they are not part of our day-to-day operating decisions. Additionally, gains and losses from other investments that are either isolated or cannot be expected to occur again with any predictability are excluded. Costs related to restructuring activities, including reducing overhead and consolidating facilities, are excluded because we believe they are not indicative of our normal operating costs. The Company independently calculates a non-GAAP adjusted tax rate to be applied to the identified non-GAAP adjustments considering the impact of discrete items on these adjustments and the jurisdictional mix of the adjustments. In addition, the tax impact of other discrete and non-recurring charges which impact our reported GAAP tax rate are adjusted from net earnings. We believe these tax items can significantly affect the period-over-period assessment of operating results and not necessarily reflect costs and/or income associated with historical trends and future results.
The Company periodically reassesses the components of our non-GAAP adjustments for changes in how we evaluate our performance, changes in how we make financial and operational decisions, and considers the use of these measures by our competitors and peers to ensure the adjustments are still relevant and meaningful.
ITEM 7A. QUANTITATIVE AND QUALITATIVE DISCLOSURES
ABOUT MARKET RISK
The Company operates internationally, and thus is subject to potentially adverse movements in foreign currency exchange rates. Approximately 27% of the Company's consolidated net sales in fiscal 2019 were made in foreign currencies, including 13% in euro, 4% in British pound sterling, 4% in Chinese yuan and the remaining 6% in other currencies. The Company is exposed to market risk primarily from foreign exchange rate fluctuations of the euro, British pound sterling, Chinese yuan and Canadian dollar as compared to the U.S. dollar as the financial position and operating results of the Company's foreign operations are translated into U.S. dollars for consolidation.
Month-end exchange rates between the euro, British pound sterling, Chinese yuan, Canadian dollar and the U.S. dollar, which have not been weighted for actual sales volume in the applicable months in the periods, were as follows:
|
Year Ended June 30, |
||||||||||||
|
2019 |
2018 |
2017 |
||||||||||
|
Euro: |
||||||||||||
|
High |
$ | 1.17 | $ | 1.24 | $ | 1.14 | ||||||
|
Low |
1.12 | 1.16 | 1.05 | |||||||||
|
Average |
1.14 | 1.20 | 1.09 | |||||||||
|
British pound sterling: |
||||||||||||
|
High |
$ | 1.32 | $ | 1.42 | $ | 1.32 | ||||||
|
Low |
1.27 | 1.29 | 1.22 | |||||||||
|
Average |
1.29 | 1.35 | 1.27 | |||||||||
|
Chinese yuan: |
||||||||||||
|
High |
$ | 0.15 | $ | 0.16 | $ | 0.15 | ||||||
|
Low |
0.14 | 0.15 | 0.14 | |||||||||
|
Average |
0.15 | 0.15 | 0.15 | |||||||||
|
Canadian dollar: |
||||||||||||
|
High |
$ | 0.77 | $ | 0.81 | $ | 0.77 | ||||||
|
Low |
0.74 | 0.76 | 0.73 | |||||||||
|
Average |
0.76 | 0.79 | 0.75 | |||||||||
The Company's exposure to foreign exchange rate fluctuations also arises from trade receivables and intercompany payables denominated in one currency in the financial statements, but receivable or payable in another currency.
The Company does not enter into foreign currency forward contracts to reduce its exposure to foreign currency rate changes on forecasted intercompany sales transactions or on intercompany foreign currency denominated balance sheet positions. Foreign currency transaction gains and losses are included in "Other non-operating expense, net" in the Consolidated Statement of Earnings and Comprehensive Income. The effect of translating net assets of foreign subsidiaries into U.S. dollars are recorded on the Consolidated Balance Sheet as part of "Accumulated other comprehensive income (loss)."
The effects of a hypothetical simultaneous 10% appreciation in the U.S. dollar from June 30, 2019 levels against the euro, British pound sterling, Chinese yuan and Canadian dollar are as follows (in thousands):
|
Decrease in translation of 2019 earnings into U.S. dollars |
$ | 3,810 | ||
|
Decrease in translation of net assets of foreign subsidiaries |
43,242 | |||
|
Additional transaction losses |
4,484 |
ITEM 8. FINANCIAL STATEMENTS AND SUPPLEMENTARY DATA
CONSOLIDATED STATEMENTS OF EARNINGS AND COMPREHENSIVE INCOME
Bio-Techne Corporation and Subsidiaries
(in thousands, except per share data)
|
Year Ended June 30, |
||||||||||||
|
2019 |
2018 |
2017 |
||||||||||
|
Net sales |
$ | 714,006 | $ | 642,993 | $ | 563,003 | ||||||
|
Cost of sales |
240,515 | 210,850 | 188,462 | |||||||||
|
Gross margin |
473,491 | 432,143 | 374,541 | |||||||||
|
Operating expenses: |
||||||||||||
|
Selling, general and administrative |
264,359 | 240,636 | 200,443 | |||||||||
|
Research and development |
62,413 | 55,329 | 53,514 | |||||||||
|
Total operating expenses |
326,772 | 295,965 | 253,957 | |||||||||
|
Operating income |
146,719 | 136,178 | 120,584 | |||||||||
|
Other income (expense): |
||||||||||||
|
Interest expense |
(21,705 |
) |
(10,188 |
) |
(7,361 |
) |
||||||
|
Interest income |
569 | 409 | 304 | |||||||||
|
Other non-operating income (expense), net |
(13,568 |
) |
(447 |
) |
(1,566 |
) |
||||||
|
Total other income (expense), net |
(34,704 |
) |
(10,226 |
) |
(8,623 |
) |
||||||
|
Earnings before income taxes |
112,015 | 125,952 | 111,961 | |||||||||
|
Income taxes (benefit) |
15,943 |
|
(198) |
|
35,875 | |||||||
|
Net earnings |
96,072 | 126,150 | 76,086 | |||||||||
|
Other comprehensive income (loss): |
||||||||||||
|
Foreign currency translation adjustments |
(4,487 |
) |
(1,572 |
) |
(3,061 |
) |
||||||
| Unrealized gains (losses) on derivative instruments - cash flow hedges, net of tax of $2,921 in FY19 | (9,537 | ) | - | - | ||||||||
|
Unrealized gains (losses) on available-for-sale investments, net of tax of $398 in FY18 and $(6,501) in FY17 |
- | 5,693 | 24,531 | |||||||||
|
Other comprehensive income (loss) |
(14,024 | ) | 4,121 | 21,470 | ||||||||
|
Comprehensive income |
$ | 82,048 | 130,271 | $ | 97,556 | |||||||
|
Earnings per share: |
||||||||||||
|
Basic |
$ | 2.54 | $ | 3.36 | $ | 2.04 | ||||||
|
Diluted |
$ | 2.47 | $ | 3.31 | $ | 2.03 | ||||||
|
Weighted average common shares outstanding: |
||||||||||||
|
Basic |
37,781 | 37,476 | 37,313 | |||||||||
|
Diluted |
38,892 | 38,055 | 37,500 | |||||||||
See Notes to Consolidated Financial Statements.
CONSOLIDATED BALANCE SHEETS
Bio-Techne Corporation and Subsidiaries
(in thousands, except share and per share data)
|
June 30, |
||||||||
|
2019 |
2018 |
|||||||
|
ASSETS |
||||||||
|
Current assets: |
||||||||
|
Cash and cash equivalents |
$ | 100,886 | $ | 121,990 | ||||
|
Short-term available-for-sale investments |
65,147 | 59,764 | ||||||
|
Accounts receivable, less allowance for doubtful accounts of $980 and $839, respectively |
137,466 | 120,296 | ||||||
|
Inventories |
91,050 | 85,648 | ||||||
|
Other current assets |
18,058 | 10,668 | ||||||
|
Total current assets |
412,607 | 398,366 | ||||||
|
Property and equipment, net |
154,039 | 145,348 | ||||||
|
Goodwill |
732,667 | 597,890 | ||||||
|
Intangible assets, net |
579,429 | 446,332 | ||||||
|
Other assets |
5,668 | 5,266 | ||||||
|
Total assets |
$ | 1,884,410 | $ | 1,593,202 | ||||
|
LIABILITIES AND SHAREHOLDERS' EQUITY |
||||||||
|
Current liabilities: |
||||||||
|
Trade accounts payable |
$ | 16,210 | $ | 18,452 | ||||
|
Salaries, wages and related accruals |
28,638 | 23,710 | ||||||
|
Accrued expenses |
26,389 | 20,361 | ||||||
|
Contract liabilities |
9,084 | 8,109 | ||||||
|
Income taxes payable |
5,764 | 8,878 | ||||||
|
Contingent consideration payable |
3,400 | - | ||||||
| Current portion of long-term debt obligations | 12,500 | - | ||||||
|
Total current liabilities |
101,985 | 79,510 | ||||||
|
Deferred income taxes |
89,754 | 86,293 | ||||||
|
Long-term debt obligations |
492,660 | 339,000 | ||||||
|
Long-term contingent consideration payable |
9,200 | - | ||||||
|
Other long-term liabilities |
25,222 | 9,338 | ||||||
|
Shareholders' equity: |
||||||||
|
Undesignated capital stock, no par; authorized 5,000,000 shares; none issued or outstanding |
- | - | ||||||
|
Common stock, par value $.01 a share; authorized 100,000,000 shares; issued and outstanding 37,934,040 and 37,607,500 shares, respectively |
379 | 376 | ||||||
|
Additional paid-in capital |
316,797 | 246,568 | ||||||
|
Retained earnings |
931,934 |
876,931 | ||||||
|
Accumulated other comprehensive loss |
(83,521 |
) |
(44,814 |
) |
||||
|
Total shareholders' equity |
1,165,589 | 1,079,061 | ||||||
|
Total liabilities and shareholders’ equity |
$ | 1,884,410 | $ | 1,593,202 | ||||
See Notes to Consolidated Financial Statements.
CONSOLIDATED STATEMENTS OF SHAREHOLDERS' EQUITY
Bio-Techne Corporation and Subsidiaries
(in thousands)
|
Common Stock |
Additional |
Retained |
Accumulated |
|||||||||||||||||||||
|
Shares |
Amount |
Capital |
Earnings |
Income(Loss) |
Total |
|||||||||||||||||||
|
Balances at June 30, 2016 |
37,254 | $ | 372 | $ | 178,760 | $ | 770,553 | $ | (70,405 |
) |
$ | 879,280 | ||||||||||||
|
Net earnings |
76,086 | 76,086 | ||||||||||||||||||||||
|
Other comprehensive income (loss) |
21,470 | 21,470 |
|
|||||||||||||||||||||
|
Surrender and retirement of stock to exercise options |
(3 |
) |
- | (275 |
) |
(275 |
) |
|||||||||||||||||
|
Common stock issued for exercise of options |
63 | 2 | 4,509 | 4,511 | ||||||||||||||||||||
|
Common stock issued for restricted stock awards |
31 | - | - | (287 |
) |
(287 |
) |
|||||||||||||||||
|
Cash dividends |
(47,325 |
) |
(47,325 |
) |
||||||||||||||||||||
|
Stock-based compensation expense |
14,418 | 14,418 | ||||||||||||||||||||||
|
Tax benefit from exercise of stock options |
514 | 514 | ||||||||||||||||||||||
|
Common stock issued to employee stock purchase plan |
11 | - | 1,022 | 1,022 | ||||||||||||||||||||
|
Employee stock purchase plan expense |
213 | 213 | ||||||||||||||||||||||
|
Balances at June 30, 2017 |
37,356 | $ | 374 | $ | 199,161 | $ | 799,027 | $ | (48,935 |
) |
$ | 949,627 | ||||||||||||
|
Net earnings |
126,150 | 126,150 | ||||||||||||||||||||||
|
Other comprehensive income (loss) |
4,121 | 4,121 | ||||||||||||||||||||||
|
Common stock issued for exercise of options |
204 | 2 | 17,661 | 17,663 |
|
|||||||||||||||||||
|
Common stock issued for restricted stock awards |
34 | - | - | (273 |
) |
(273 | ) | |||||||||||||||||
|
Cash dividends |
- | (47,973 |
) |
(47,973 |
) |
|||||||||||||||||||
|
Stock-based compensation expense |
27,959 | 27,959 |
|
|||||||||||||||||||||
|
Common stock issued to employee stock purchase plan |
14 | - | 1,506 | 1,506 | ||||||||||||||||||||
|
Employee stock purchase plan expense |
281 | 281 | ||||||||||||||||||||||
|
Balances at June 30, 2018 |
37,608 | $ | 376 | $ | 246,568 | $ | 876,931 | $ | (44,814 |
) |
$ | 1,079,061 | ||||||||||||
| Cumulative effect adjustments due to adoption of new accounting standards and other | 25,276 | (24,682 | ) | 594 | ||||||||||||||||||||
|
Net earnings |
96,072 | 96,072 | ||||||||||||||||||||||
|
Other comprehensive income (loss) |
(14,024 | ) | (14,024 | ) | ||||||||||||||||||||
| Share repurchases | (95 | ) | (1 | ) | (15,404 | ) | (15,405 | ) | ||||||||||||||||
|
Common stock issued for exercise of options |
382 |
4 | 36,272 | 36,276 | ||||||||||||||||||||
|
Common stock issued for restricted stock awards |
29 | - | (2,575 | ) | (2,575 | ) | ||||||||||||||||||
|
Cash dividends |
(48,366 | ) | (48,364 | ) | ||||||||||||||||||||
|
Stock-based compensation expense |
31,775 | 31,775 | ||||||||||||||||||||||
|
Common stock issued to employee stock purchase plan |
10 | - | 1,676 |
1,676 |
||||||||||||||||||||
|
Employee stock purchase plan expense |
505 | 505 | ||||||||||||||||||||||
|
Balances at June 30, 2019 |
37,934 | $ | 379 | $ | 316,797 | $ | 931,934 | $ | (83,521 | ) | $ | 1,165,589 | ||||||||||||
See Notes to Consolidated Financial Statements.
CONSOLIDATED STATEMENTS OF CASH FLOWS
Bio-Techne Corporation and Subsidiaries
(in thousands)
|
Year Ended June 30, |
||||||||||||
|
2019 |
2018 |
2017 |
||||||||||
|
Cash flows from operating activities: |
||||||||||||
|
Net earnings |
$ | 96,072 | $ | 126,150 | $ | 76,086 | ||||||
|
Adjustments to reconcile net earnings to net cash provided by operating activities: |
||||||||||||
|
Depreciation and amortization |
78,171 | 64,463 | 60,036 | |||||||||
|
Costs recognized on sale of acquired inventory |
3,739 | 2,455 | 3,037 | |||||||||
|
Deferred income taxes |
(13,582 |
) |
(46,716 |
) |
(3,433 |
) |
||||||
|
Stock-based compensation expense |
32,280 | 28,240 | 14,631 | |||||||||
|
Fair value adjustment to contingent consideration payable |
(2,000 | ) | 20,100 | 18,400 | ||||||||
|
Contingent consideration payments |
- |
|
(26,600 |
) |
(11,800 |
) |
||||||
|
Gain on investment, net |
(3,702 | ) | (397 |
) |
- | |||||||
| Fair value adjustment on available for sale investments | 16,067 | - | - | |||||||||
|
Other operating activity |
2,325 | 776 | 2,215 | |||||||||
|
Change in operating assets and liabilities, net of acquisitions: |
||||||||||||
|
Trade accounts and other receivables |
(15,000 |
) |
(2,700 |
) |
(19,686 |
) |
||||||
|
Inventories |
(13,647 |
) |
(13,327 |
) |
(732 |
) |
||||||
|
Prepaid expenses |
(698 | ) | 2,782 | (2,088 |
) |
|||||||
|
Trade accounts payable and accrued expenses |
6,101 | 5,026 | 5,695 | |||||||||
|
Salaries, wages and related accruals |
5,013 |
|
(89 |
) |
661 | |||||||
|
Income taxes payable |
(9,520 | ) | 10,204 | 699 | ||||||||
|
Net cash provided by operating activities |
181,619 | 170,367 | 143,721 | |||||||||
|
Cash flows from investing activities: |
||||||||||||
|
Proceeds from sale and maturities of available-for-sale investments |
21,579 | 36,390 | 6,079 | |||||||||
|
Purchase of available-for-sale investments |
(43,475 | ) | (8,571 |
) |
(3,069 |
) |
||||||
|
Additions to property and equipment |
(25,411 |
) |
(20,934 |
) |
(15,179 |
) |
||||||
|
Acquisitions, net of cash acquired |
(289,492 |
) |
(67,851 |
) |
(253,785 |
) |
||||||
|
Investment in unconsolidated entity |
- | 21,574 | (40,000 |
) |
||||||||
|
Other investing activities |
- | 680 | - | |||||||||
|
Net cash used in investing activities |
(336,799 |
) |
(38,712 |
) |
(305,954 |
) |
||||||
|
Cash flows from financing activities: |
||||||||||||
|
Cash dividends |
(48,364 |
) |
(47,973 |
) |
(47,325 |
) |
||||||
|
Proceeds from stock option exercises |
37,950 | 19,170 | 5,257 | |||||||||
| Re-purchases of common stock | (15,405 | ) | - | - | ||||||||
|
Excess tax benefit from stock option exercises |
- | - | 514 | |||||||||
|
Borrowings under line-of-credit agreement |
580,000 | 55,000 | 368,500 | |||||||||
|
Payments on line-of-credit |
(413,500 |
) |
(59,500 |
) |
(116,500 |
) |
||||||
|
Contingent consideration payments |
- |
|
(61,900 |
) |
(20,316 |
) |
||||||
|
Other financing activities |
(6,297 |
) |
(3,985 |
) |
(1,017 |
) |
||||||
|
Net cash provided by (used in) financing activities |
134,384 |
|
(99,188 |
) |
189,113 | |||||||
|
Effect of exchange rate changes on cash and cash equivalents |
(308 |
) |
(2,089 |
) |
495 | |||||||
|
Net change in cash and cash equivalents |
(21,104 | ) | 30,378 | 27,375 | ||||||||
|
Cash and cash equivalents at beginning of year |
121,990 | 91,612 | 64,237 | |||||||||
|
Cash and cash equivalents at end of year |
$ | 100,886 | $ | 121,990 | $ | 91,612 | ||||||
See Notes to Consolidated Financial Statements.
NOTES TO CONSOLIDATED FINANCIAL STATEMENTS
Bio-Techne Corporation and Subsidiaries
Years ended June 30, 2019, 2018 and 2017
Note 1. Description of Business and Summary of Significant Accounting Policies:
Description of business: Bio-Techne and its subsidiaries, collectively doing business as Bio-Techne Corporation (the Company), develop, manufacture and sell life science reagents, instruments and services for the research and clinical diagnostic markets worldwide. With our deep product portfolio and application expertise, we sell integral components of scientific investigations into biological processes and molecular diagnostics, revealing the nature, diagnosis, etiology and progression of specific diseases. Our products aid in drug discovery efforts and provide the means for accurate clinical tests and diagnoses.
Use of estimates: The preparation of consolidated financial statements in conformity with accounting principles generally accepted in the United States of America requires management to make estimates and assumptions that affect the reported amounts of assets and liabilities, disclosures of contingent assets and liabilities at the date of the consolidated financial statements, and the reported amounts of revenues and expenses during the reporting period. These estimates include the valuation of accounts receivable, available-for-sale investments, inventory, intangible assets, contingent consideration, stock-based compensation and income taxes. Actual results could differ from these estimates.
Principles of consolidation: The consolidated financial statements include the accounts of the Company and its wholly-owned subsidiaries. All intercompany accounts and transactions have been eliminated.
Translation of foreign financial statements: Assets and liabilities of the Company's foreign operations are translated at year-end rates of exchange and the resulting gains and losses arising from the translation of net assets located outside the U.S. are recorded as other comprehensive income (loss) on the consolidated statements of earnings and comprehensive income. The cumulative translation adjustment is a component of accumulated other comprehensive loss on the consolidated balance sheets. Foreign statements of earnings are translated at the average rate of exchange for the year. Foreign currency transaction gains and losses are included in other non-operating expense in the consolidated statements of earnings and comprehensive income.
Revenue recognition: The Company adopted ASC 606 - Revenue from Contracts with Customers on July 1, 2018 using the modified retrospective transition approach. ASC 606 provides revenue recognition guidance for any entity that enters into contracts with customers to transfer goods or services or enters into contracts for the transfer of non-financial assets, unless those contracts are within the scope of other accounting standards. The core principle of ASC 606 is that revenue should be recognized to depict the transfer of promised goods or services to customers in an amount that reflects the consideration to which the entity expects to be entitled in exchange for those goods or services. Refer to the Recently Adopted Accounting Pronouncements section of Note 1 for additional information regarding our adoption of ASC 606 and and Note 2 for additional information regarding our revenue recognition policy under ASC 606.
Research and development: Research and development expenditures are expensed as incurred. Development activities generally relate to creating new products, improving or creating variations of existing products, or modifying existing products to meet new applications.
Advertising costs: Advertising expenses were $4.1 million, $3.8 million, and $4.5 million for fiscal 2019, 2018, and 2017 respectively. The Company expenses advertising expenses as incurred.
Income taxes: The Company uses the asset and liability method of accounting for income taxes. Deferred tax assets and liabilities are recognized to record the income tax effect of temporary differences between the tax basis and financial reporting basis of assets and liabilities. Deferred tax assets and liabilities are measured using enacted tax rates expected to apply to taxable income in the years in which those temporary differences are expected to be recovered or settled. The effect on deferred tax assets and liabilities of a change in tax rates is recognized in income in the period that includes the enactment date. Tax positions taken or expected to be taken in a tax return are recognized in the financial statements when it is more likely than not that the position would be sustained upon examination by tax authorities. A recognized tax position is then measured at the largest amount of benefit that is greater than fifty percent likely of being realized upon ultimate settlement. The Company recognizes interest and penalties related to unrecognized tax benefits in income tax expense.
See Note 11 for additional information regarding income taxes.
Comprehensive income: Comprehensive income includes charges and credits to shareholders' equity that are not the result of transactions with shareholders. Our total comprehensive income consists of net income, unrealized gains and losses on cash flow hedges, and foreign currency translation adjustments. The items of comprehensive income, with the exception of net income, are included in accumulated other comprehensive loss in the consolidated balance sheets and statements of shareholders' equity.
Cash and cash equivalents: Cash and cash equivalents include cash on hand and highly-liquid investments with original maturities of three months or less.
Available-for-sale investments: Available-for-sale investments consist of debt instruments with original maturities of generally three months to six months and equity securities. Available-for-sale investments are recorded based on trade-date. The Company considers all of its marketable securities available-for-sale and reports them at fair value. Unrealized gains and losses on available-for-sale securities are included within other income (expense) in fiscal 2019 as the Company adopted ASU 2018-02 on July 1, 2018, as further described in the Recently Adopted Accounting Pronouncements section of Note 1. Unrealized gains or losses on available-for-sale securities were recorded within comprehensive income in fiscal years 2018 and 2017.
Trade accounts receivable: Trade accounts receivable are initially recorded at the invoiced amount upon the sale of goods or services to customers, and they do not bear interest. They are stated net of allowances for doubtful accounts, which represent estimated losses resulting from the inability of customers to make the required payments. When determining the allowances for doubtful accounts, we take several factors into consideration, including the overall composition of accounts receivable aging, our prior history of accounts receivable write-offs, the type of customer and our day-to-day knowledge of specific customers. Changes in the allowances for doubtful accounts are included in selling, general and administrative (SG&A) expense in our consolidated statements of earnings and comprehensive income. The point at which uncollected accounts are written off varies by type of customer.
Inventories: Inventories are stated at the lower of cost (first-in, first-out method) or net realizable value. The Company regularly reviews inventory on hand for slow-moving and obsolete inventory, inventory not meeting quality control standards and inventory subject to expiration.
For certain proteins, antibodies, and chemically based manufactured products, the Company produces larger batches of established products than current sales requirements due to economies of scale through a highly controlled manufacturing process. Accordingly, the manufacturing process for these products has and will continue to produce quantities in excess of forecasted usage. The Company forecasts usage for its products based on several factors including historical demand, current market dynamics, and technological advances. The Company forecasts product usage on an individual product level for a period that is consistent with our ability to reasonably forecast inventory usage for that product. There have been no material changes to the Company’s estimates of the net realizable value for excess and obsolete inventory or other types of inventory reserve and inventory cost adjustments in the fiscal years presented. Additionally, current and historical reserves recorded to reduce the cost of inventory to its net realizable value become part of the new cost basis for the inventory item in accordance with ASC 330 - Inventory.
Property and equipment: Property and equipment are recorded at cost. Equipment is depreciated using the straight-line method over an estimated useful life of 3 to 5 years. Buildings, building improvements and leasehold improvements are amortized over estimated useful lives of 5 to 40 years.
Contingent Consideration: Contingent Consideration relates to the potential payment for an acquisition that is contingent upon the achievement of the acquired business meeting certain product development milestones and/or certain financial performance milestones. The Company records contingent consideration at fair value at the date of acquisition based on the consideration expected to be transferred. For potential payments related to financial performance milestones, we use a real option model in calculating the fair value of the contingent consideration liabilities. The assumptions utilized in the calculation based on financial performance milestones include projected revenue and/or EBITDA amounts, volatility and discount rates. For potential payments related to product development milestones, we estimated the fair value based on the probability of achievement of such milestones. The assumptions utilized in the calculation of the acquisition date fair value include probability of success and the discount rates. Contingent consideration involves certain assumptions requiring significant judgment and actual results may differ from assumed and estimated amounts. Contingent consideration is remeasured each reporting period, and subsequent changes in fair value, including accretion for the passage of time, are recognized within selling, general and administrative in the consolidated statement of earnings and comprehensive income
Intangibles assets: Intangible assets are stated at historical cost less accumulated amortization. Amortization expense is generally determined on the straight-line basis over periods ranging from 1 year to 20 years. Each reporting period, we evaluate the remaining useful lives of our amortizable intangibles to determine whether events or circumstances warrant a revision to the remaining period of amortization. If our estimate of an asset's remaining useful life is revised, the remaining carrying amount of the asset is amortized prospectively over the revised remaining useful life. In the current year, the Company has identified no such events.
Impairment of long-lived assets and amortizable intangibles: We evaluate the recoverability of property, plant, equipment and amortizable intangibles whenever events or changes in circumstances indicate that an asset's carrying amount may not be recoverable. Such circumstances could include, but are not limited to, (1) a significant decrease in the market value of an asset, (2) a significant adverse change in the extent or manner in which an asset is used or in its physical condition, or (3) an accumulation of costs significantly in excess of the amount originally expected for the acquisition or construction of an asset. We compare the carrying amount of the asset to the estimated undiscounted future cash flows associated with it. If the sum of the expected future net cash flows is less than the carrying value of the asset being evaluated, an impairment loss would be recognized. The impairment loss would be calculated as the amount by which the carrying value of the asset exceeds the fair value of the asset. As quoted market prices are not available for the majority of our assets, the estimate of fair value is based on various valuation techniques, including the discounted value of estimated future cash flows.
The evaluation of asset impairment requires us to make assumptions about future cash flows over the life of the asset being evaluated. These assumptions require significant judgment and actual results may differ from assumed and estimated amounts. No triggering events were identified and no impairments were recorded for property, plant, and equipment or amortizable intangibles during fiscal years 2017, 2018, and 2019.
Impairment of goodwill: We evaluate the carrying value of goodwill during the fourth quarter each year and between annual evaluations if events occur or circumstances change that would indicate a possible impairment. Such circumstances could include, but are not limited to, (1) a significant adverse change in legal factors or in business climate, (2) unanticipated competition, (3) an adverse action or assessment by a regulator, or (4) an adverse change in market conditions that are indicative of a decline in the fair value of the assets.
To analyze goodwill for impairment, we must assign our goodwill to individual reporting units. Identification of reporting units includes an analysis of the components that comprise each of our operating segments, which considers, among other things, the manner in which we operate our business and the availability of discrete financial information. Components of an operating segment are aggregated to form one reporting unit if the components have similar economic characteristics. We periodically review our reporting units to ensure that they continue to reflect the manner in which we operate our business.
2019 Goodwill Impairment Analyses
At the beginning of the quarter ended March 31, 2019, the Company realigned the management of certain business processes between reporting units within the same reportable segment. A goodwill allocation was performed between the impacted reporting units based on the relative fair value of the processes realigned. In conjunction with the realignment, a quantitative goodwill impairment assessment was performed both prior to and subsequent to the realignment. The quantitative assessment indicated that all of the impacted reporting units had substantial headroom both prior to and subsequent to the realignment.
Because our quantitative analysis performed as of January 1, 2019 included all of our reporting units, except for our recent acquisition, Exosome, which is a separate reporting unit that was not impacted by the business process realignment, the summation of the calculated reporting units’ fair values combined with the fair value of the Exosome acquisition, was compared to our consolidated fair value, as indicated by our market capitalization, to evaluate the reasonableness of our calculations.
The quantitative assessments completed as of January 1, 2019 indicated that all tested reporting units had a substantial amount of headroom. Changes in the reporting unit’s results, forecast assumptions and estimates could materially affect the estimation of the fair value of the reporting units.
The Company has elected April 1 as our annual goodwill impairment date for the Exosome reporting unit. The Company has historically completed our goodwill impairment assessment of our legacy reporting units as of June 30. To better align with our annual internal planning and operating cycle and the underlying changes in our organizational model and business, we changed our annual goodwill impairment assessment for all legacy reporting units to be as of April 1. Given the substantial headroom in our legacy reporting units and the time period the assessment was performed relative to the most recent quantitative analysis, management does not consider the change in our annual impairment assessment to be material to the consolidated financial statements or to constitute a material change in the application of our goodwill accounting principle.
In conducting our annual goodwill impairment test, we elected to perform a qualitative assessment to determine whether changes in events or circumstances since our most recent quantitative test for goodwill impairment indicated that it is more likely than not that the fair value of a reporting unit is less than its carrying amount.
Based on its annual analysis, the Company determined there was no indication of impairment of goodwill. Further, no triggering events or items beyond the realignment discussed above were identified in the year ended June 30, 2019 that would require an additional goodwill impairment assessment beyond our required annual goodwill impairment assessment.
2018 and 2017 Goodwill Impairment Analyses
In completing our 2018 and 2017 annual goodwill impairment analyses, we elected to perform a quantitative assessment for all of our reporting units. A quantitative assessment involves comparing the carrying value of the reporting unit, including goodwill, to its estimated fair value. Carrying value is based on the assets and liabilities associated with the operations of the reporting unit, which often requires the allocation of shared or corporate items among reporting units. In accordance with ASU 2017- 04, a goodwill impairment charge is recorded for the amount by which the carrying value of a reporting unit exceeds the fair value of the reporting unit. In determining the fair values of our reporting units, we utilized the income approach. The income approach is a valuation technique under which we estimated future cash flows using the reporting unit’s financial forecast from the perspective of an unrelated market participant. Using historical trending and internal forecasting techniques, we projected revenue and applied our fixed and variable cost experience rates to the projected revenue to arrive at the future cash flows. A terminal value was then applied to the projected cash flow stream. Future estimated cash flows were discounted to their present value to calculate the estimated fair value. The discount rate used was the value- weighted average of our estimated cost of capital derived using both known and estimated customary market metrics. In determining the estimated fair value of a reporting unit, we were required to estimate a number of factors, including projected operating results, terminal growth rates, economic conditions, anticipated future cash flows, the discount rate and the allocation of shared or corporate items.
The quantitative assessment completed as of June 30, 2018 and 2017 indicated that all of the reporting units had a substantial amount of headroom. This impairment assessment is sensitive to changes in forecasted cash flows, as well as our selected discount rate. Changes in the reporting unit’s results, forecast assumptions and estimates could materially affect the estimation of the fair value of the reporting units.
There has been no impairment of goodwill since the adoption of Financial Accounting Standards Board (“FASB”) ASC 350 guidance for goodwill and other intangibles on July 1, 2002.
Investments in unconsolidated entities: The Company periodically invests in the equity of start-up and early development stage companies. The accounting treatment of each investment (cost method or equity method) is dependent upon a number of factors, including, but not limited to, the Company's share in the equity of the investee and the Company's ability to exercise significant influence over the operating and financial policies of the investee.
Other Significant Accounting Policies
The following table includes a reference to additional significant accounting policies that are described in other notes to the financial statements, including the note number:
|
Policy |
Note |
|||
|
Fair value measurements |
5 | |||
|
Earnings per share |
9 | |||
|
Share-based compensation |
10 | |||
|
Reportable segments |
12 | |||
Recently Adopted Accounting Pronouncements
In May 2014, the FASB issued ASU No. 2014-09, Revenue from Contracts with Customers (ASC 606). On July 1, 2018, the Company adopted ASC 606 using the modified retrospective method for all contracts. Results for reporting periods beginning July 1, 2018 are presented under ASC 606, while prior period amounts were not adjusted and continue to be reported in accordance with the Company’s historic accounting under Topic 605, Revenue Recognition. The impact of the adoption of ASC 606 was not material to the Company's consolidated financial statements and therefore the periods reported under ASC 606 and ASC 605 are considered comparable in all material respects.
In January 2016, the FASB issued ASU No. 2016-01 Recognition and Measurement of Financial Assets and Financial Liabilities. The standard is intended to improve the recognition, measurement, presentation and disclosure of financial instruments. Among other changes, there will no longer be an available-for-sale classification for which changes in fair value are currently reported in other comprehensive income for equity securities with readily determinable fair values. Equity investments with readily determinable fair values will be measured at fair value with changes in fair value recognized in net income. ASU 2016-01 was effective for us on July 1, 2018 which required a cumulative effect adjustment to opening retained earnings to be recorded for equity investments with readily determinable fair values. As of the adoption date, we held publicly traded equity investments with a fair value of $54.3 million in a net unrealized gain position of $35.4 million, and having an associated deferred tax liability of $8.3 million. We recorded a cumulative-effect adjustment of $27.1 million to decrease Accumulated Other Comprehensive Income (AOCI) with a corresponding increase to retained earnings for the amount of unrealized gains, net of tax as of the beginning of fiscal year 2019. As a result of the implementation of ASU 2016-01, effective on July 1, 2018 unrealized gains and losses in equity investments with readily determinable fair values are recorded on the Consolidated Statement of Income within other (expense) income. We recorded a gain in other (expense) income of $12.3 million and $2.9 million for the quarter and nine month period ended March 31, 2019 as a result of adopting this standard. The implementation of ASU 2016-01 is expected to increase volatility in our net income as the volatility previously recorded in Other Comprehensive Income (OCI) related to changes in the fair market value of available-for-sale equity investments will now be reflected in net income effective with the adoption date.
In February 2018, the FASB issued ASU No. 2018-02, Reclassification of Certain Tax Effects from Accumulated Other Comprehensive Income. The standard allows companies to make an election to reclassify from Accumulated Other Comprehensive Income (AOCI) to retained earnings the stranded tax effects resulting from the Tax Cuts and Jobs Act of 2017. This ASU is effective for annual and interim periods beginning after December 15, 2018, which for us is July 1, 2019. Early adoption is permitted. We elected to early adopt ASU 2018-02 on July 1, 2018. We use a specific identification approach to release the income tax effects in AOCI. As a result of adopting this standard, we recorded a cumulative effect adjustment to increase AOCI by $2.4 million with a corresponding decrease to retained earnings. We recorded the impacts of adopting ASU 2018-02 prior to recording the impacts of adopting ASU 2016-01 and included state income tax related effects in the amounts reclassified to retained earnings.
The following table presents a summary of cumulative effect adjustments to retained earnings due to the adoption of new accounting standards on July 1, 2018 as noted above:
|
|
|
Cumulative Effect Adjustments to Retained Earnings on July 1, 2018 Increase / (Decrease) |
|
|
|
Cumulative effect adjustment to retained earnings due to the adoption of the following new accounting standards: |
|
|
|
|
|
ASU 2014-09 |
|
$ |
98 |
|
|
ASU 2016-01 |
|
|
27,053 |
|
|
ASU 2018-02 |
|
|
(2,371 |
) |
|
Net cumulative effect adjustments to retained earnings on July 1, 2018 due to the adoption of new accounting standards |
|
$ |
24,780 |
|
In January 2017, the FASB issued ASU No. 2017-01, Clarifying the Definition of a Business. The standard revises the definition of a business, which affects many areas of accounting such as business combinations and disposals and goodwill impairment. The revised definition of a business will likely result in more acquisitions being accounted for as asset acquisitions, as opposed to business combinations. We adopted this standard on July 1, 2018, applying the guidance to transactions occurring on or after this date.
In August 2017, the FASB issued ASU No. 2017-12, Targeted Improvements to Accounting for Hedging Activities. The standard changes the designation and measurement guidance for qualifying hedging relationships to better align financial reporting to risk management activities. As part of the guidance, the entire change in fair value of a qualifying hedging instrument will be recorded within other comprehensive income which is then reclassified into earnings in the same period or periods during which the hedged item impacts earnings. Additionally, the gain or loss resulting from the hedging activity will be presented in the same income statement line item as the hedged item. The standard is effective for interim and annual reporting periods in fiscal years beginning after December 15, 2018, which for us is July 1, 2019. Early adoption is permitted. We elected to early adopt ASU 2017-12 on October 1, 2018, prior to the Company entering into cash flow hedges as described in Note 5. The adoption of this standard did not have a material impact on our consolidated financial statements.
Pronouncements Issued but Not Yet Adopted
In February 2016, the FASB issued ASU 2016-02, Leases (Topic 842), which amends the existing guidance to require lessees to recognize lease assets and lease liabilities from operating leases on the balance sheet. This ASU is effective using the modified retrospective approach for annual periods and interim periods within those annual periods beginning after December 15, 2018, which for us is July 1, 2019. Early adoption is permitted. The FASB has issued narrow codification improvements to Leases (Topic 842) through ASU No. 2018-10 and ASU 2019-01. Additionally, the FASB issued ASU 2018-11, allowing an entity to elect a transition method where they do not recast prior periods presented in the financial statements in the period of adoption. The Company plans to elect the transition method allowed for under ASU 2018-11 when adopting Leases (Topic 842). The Company has completed detailed reviews over all lease agreements, assessed internal control impacts for ongoing lease accounting changes, and completed internal control testing and validation procedures over our new lease accounting software. The Company does not expect this standard to have a material impact on its consolidated statements of earnings and comprehensive income. The Company does expect an increase of approximately $82 million for lease assets and liabilities and an immaterial impact to retained earnings in our Consolidated Balance Sheet.
In June 2016, the FASB issued ASU 2016-13, Financial Instruments - Credit Losses (Topic 326), Measurement of Credit Losses on Financial Instruments. The amendment in this update replace the incurred loss impairment methodology in current GAAP with a methodology that reflects expected credit losses on instruments within its scope, including trade and loan receivables and available-for-sale debt securities. This update is intended to provide financial statement users with more decision-useful information about the expected credit losses. This ASU is effective for annual periods and interim periods for those annual periods beginning after December 15, 2019, which for us is July 1, 2020. Entities may early adopt beginning after December 15, 2018. We are currently evaluating the impact of the adoption of ASU 2016-13 on our consolidated financial statements.
In August 2018, the FASB issued ASU No. 2018-15, Customer's Accounting for Implementation Costs Incurred in a Cloud Computing Arrangement That Is a Service Contract. The standard aligns the requirements for capitalizing implementation costs incurred in a hosting arrangement that is a service contract with the requirements for capitalizing implementation costs incurred to develop or obtain internal-use software. The accounting for the service element of a hosting arrangement that is a service contract is not affected by the new standard. This ASU is effective for annual periods and interim periods for those annual periods beginning after December 15, 2019, which for us is July 1, 2020 and may be adopted retrospectively or prospectively to eligible costs incurred on or after the date the guidance is first applied. We are currently evaluating the impact of the adoption of ASU 2018-15 on our consolidated financial statements and anticipate that we will adopt the standard prospectively.
Note 2. Revenue Recognition:
Consumables revenues consist of single-use products and are recognized at a point in time following the transfer of control of such products to the customer, which generally occurs upon shipment. Instruments revenues typically consist of longer-lived assets that, for the substantial majority of sales, are recognized at a point in time in a manner similar to consumables. The vast majority of service revenues consist of extended warranty contracts, post contract support (“PCS”), and custom development projects that are recognized over time as either the customers receive and consume the benefits of such services simultaneously or the underlying asset being developed has no alternative use for the Company at contract inception and the Company has an enforceable right to payment for the portion of the performance completed. The remaining service revenues were not material to the period and consist of laboratory services recognized at point in time. Given the Company does not have significant historical experience collecting payments from Medicare or insurance providers, the Company considered the variable consideration for such services to be constrained as it would not be probable that a significant amount of revenue would not need to be reversed in future periods for the services provided. Accordingly, the Company did not record revenue upon completion of the performance obligation, but rather upon cash receipt, which was subsequent to the performance obligation being satisfied. Royalty revenues are based on net sales of the Company’s licensed products by a third party. We recognize royalty revenues in the period the sales occur using third party evidence. The Company has also elected the "right to invoice" practical expedient based on the Company's right to invoice a customer at an amount that approximates the value to the customer and the performance completed to date.
The Company has elected the exemption to not disclose the unfulfilled performance obligations for contracts with an original length of one year or less and the exemption to exclude future performance obligations that are accounted under the sales-based or usage-based royalty guidance. The Company's unfulfilled performance obligations were not material as of June 30, 2019.
Contracts with customers that contain instruments may include multiple performance obligations. For these contracts, the Company allocates the contract’s transaction price to each performance obligation on a relative standalone selling price basis. Allocation of the transaction price is determined at the contracts’ inception.
Payment terms for shipments to end-users are generally net 30 days. Payment terms for distributor shipments may range from 30 to 90 days. Service arrangements commonly call for payments in advance of performing the work (e.g. extended warranty and service contracts), upon completion of the service (e.g. custom development manufacturing) or a mix of both.
Contract assets include revenues recognized in advance of billings. Contract assets are included within other current assets in the accompanying balance sheet as the amount of time expected to lapse until the company's right to consideration becomes unconditional is less than one year. We elected the practical expedient allowing us to expense costs of obtaining contracts less than one year that would otherwise be capitalized and amortized over the contract period. Contract assets as of June 30, 2019 are not material.
Contract liabilities include billings in excess of revenues recognized, such as those resulting from customer advances and deposits and unearned revenue on warranty contracts. Contract liabilities as of June 30, 2019 and June 30, 2018 were approximately $10.4 million and $9.3 million, respectively. Contract liabilities as of June 30, 2018 subsequently recognized as revenue during the year ended June 30, 2019 were approximately $7.0 million. Contract liabilities in excess of one year are included in Other long-term liabilities on the balance sheet.
Any claims for credit or return of goods must be made within 10 days of receipt. Revenues are reduced to reflect estimated credits and returns. Although the amounts recorded for these revenue deductions are dependent on estimates and assumptions, historically our adjustments to actual results have not been material.
Taxes collected from customers relating to product sales and remitted to governmental authorities are excluded from revenue. Amounts billed to customers for shipping and handling are included in revenue, while the related shipping and handling costs are reflected in cost of products. We have elected the practical expedient that allows us to account for shipping and handling activities that occur after the customer has obtained control of a good as a fulfillment cost, and we accrue costs of shipping and handling when the related revenue is recognized.
The following tables present our disaggregated revenue for the periods presented.
Revenue by type is as follows:
|
Year ended June 30, |
||||||||||||
|
2019 |
2018 |
2017 | ||||||||||
|
Consumables |
$ | 588,979 | $ | 534,738 | $ | 476,541 | ||||||
|
Instruments |
67,538 | 61,784 | 47,751 | |||||||||
|
Services |
38,050 | 34,137 | 23,652 | |||||||||
|
Total product and services revenue, net |
694,567 | $ | 630,659 | 547,944 | ||||||||
|
Royalty revenues |
19,439 | 12,334 | 15,059 | |||||||||
|
Total revenues, net |
$ | 714,006 | $ | 642,993 | $ | 563,003 | ||||||
Revenue by geography is as follows:
|
Year Ended June 30, |
||||||||||||
|
2019 |
2018 |
2017 |
||||||||||
|
Net sales: |
||||||||||||
|
United States |
$ | 391,191 | $ | 346,293 | $ | 313,195 | ||||||
|
EMEA, excluding U.K. |
155,821 | 148,599 | 125,126 | |||||||||
|
U.K. |
34,975 | 33,704 | 28,401 | |||||||||
|
APAC, excluding Greater China |
52,913 | 48,392 | 41,463 | |||||||||
|
Greater China |
57,799 | 47,950 | 39,078 | |||||||||
|
Rest of world |
21,307 | 18,055 | 15,740 | |||||||||
|
Total external sales |
$ | 714,006 | $ | 642,993 | $ | 563,003 | ||||||
Note 3. Supplemental Balance Sheet and Cash Flow Information:
Available-For-Sale Investments:
The fair value of the Company's available-for-sale investments as of June 30, 2019 and June 30, 2018 were $38.2 million and $54.3 million, respectively. The decrease was due to year-over-year decreases in the stock price of CCXI, from $13.17 per share at June 30, 2018 to $9.30 per share at June 30, 2019 resulting in a $16.1 million decrease in the fair value of the Company's investment in CCXI. The amortized cost basis of the Company's investment in CCXI was $18.8 million as of June 30, 2019 and 2018.
Inventories:
Inventories consist of (in thousands):
|
June 30, |
||||||||
|
2019 |
2018 |
|||||||
|
Raw materials |
$ | 40,913 | $ | 30,956 | ||||
|
Finished goods(1) |
53,376 | 54,692 | ||||||
|
Inventories, net |
$ | 94,289 | $ | 85,648 | ||||
(1) Finished goods inventory of $3,239 is included within other long-term assets in the June 30, 2019 Balance Sheet as it forecasted to be sold after the 12 months subsequent to the consolidated balance sheet date.
Property and Equipment:
Property and equipment consist of (in thousands):
|
June 30, |
||||||||
|
2019 |
2018 |
|||||||
|
Cost: |
||||||||
|
Land |
$ | 7,065 | $ | 7,065 | ||||
|
Buildings and improvements |
175,019 | 170,110 | ||||||
|
Machinery, equipment and other |
124,233 | 107,625 | ||||||
|
Property and equipment |
306,317 | 284,800 | ||||||
|
Accumulated depreciation and amortization |
(152,278 |
) |
(139,452 |
) |
||||
|
Property and equipment, net |
$ | 154,039 | $ | 145,348 | ||||
Intangibles assets were comprised of the following (in thousands):
|
June 30, |
|||||||||||||
|
Useful Life (years) |
2019 |
2018 |
|||||||||||
|
Developed technology |
9 | - | 15 | $ | 435,679 | $ | 305,303 | ||||||
|
Trade names |
2 | - | 20 | 147,296 | 89,608 | ||||||||
|
Customer relationships |
7 | - | 16 | 214,320 | 212,228 | ||||||||
|
Patents |
10 | 2,133 | 1,401 | ||||||||||
|
Intangible assets |
799,428 | 608,540 | |||||||||||
|
Accumulated amortization |
(219,999 |
) |
(162,208 |
) |
|||||||||
|
Intangibles assets, net |
$ | 579,429 | $ | 446,332 | |||||||||
Changes to the carrying amount of net intangible assets consist of (in thousands):
|
June 30, |
||||||||
|
2019 |
2018 |
|||||||
|
Beginning balance |
$ | 446,332 | $ | 452,042 | ||||
|
Acquisitions (Note 4) |
191,956 | 40,673 | ||||||
|
Other additions |
633 | 908 | ||||||
|
Amortization expense |
(58,715 |
) |
(47,076 |
) |
||||
|
Currency translation |
(777 |
) |
(215 |
) |
||||
|
Ending balance |
$ | 579,429 | $ | 446,332 | ||||
Amortization expense related to technologies included in cost of sales was $33.3 million, $25.3 million, and $23.1 million in fiscal 2019, 2018, and 2017, respectively. Amortization expense related to trade names, customer relationships, non-compete agreements, and patents included in selling, general and administrative expense was $25.4 million, $21.6 million, and $21.3 million, in fiscal 2019, 2018, and 2017 respectively.
The estimated future amortization expense for intangible assets as of June 30, 2019 is as follows (in thousands):
|
2020 |
$ | 59,905 | ||
|
2021 |
59,557 | |||
|
2022 |
57,905 | |||
|
2023 |
56,031 | |||
|
2024 |
53,464 | |||
|
Thereafter |
292,567 | |||
|
Total |
$ | 579,429 |
Changes in goodwill by reportable segment and in total consist of (in thousands):
|
Protein Sciences |
Diagnostics & Genomics |
Total |
||||||||||
|
June 30, 2017 |
$ | 331,789 | $ | 247,237 | $ | 579,026 | ||||||
|
Acquisitions (Note 4) |
16,186 | 2,910 | 19,096 | |||||||||
|
Currency translation |
(56 |
) |
(176 | ) | (232 | ) | ||||||
|
June 30, 2018 |
$ | 347,918 | $ | 249,972 | $ | 597,890 | ||||||
|
Acquisitions (Note 4) |
30,939 | 105,362 | 136,301 | |||||||||
|
Currency translation |
(1,450 | ) | (74 | ) | (1,524 |
) |
||||||
|
June 30, 2019 |
$ | 377,407 | $ | 355,260 | $ | 732,667 | ||||||
Other Assets:
Other assets consist of (in thousands):
|
June 30, |
||||||||
|
2019 |
2018 |
|||||||
|
Investments |
$ | - | $ | 2,606 | ||||
|
Other |
5,668 | 2,660 | ||||||
|
Other long-term assets |
$ | 5,668 | $ | 5,266 | ||||
As of June 30, 2019, the Company had $5.7 million of other assets compared to $5.3 million as of June 30, 2018. The increase was attributable to finished goods inventory of $3.2 million included within other long-term assets in the June 30, 2019 Balance Sheet as it forecasted to be sold after the 12 months subsequent to the consolidated balance sheet date. This increase was partially offset by the reduction in investments related to our purchase of the outstanding shares of B-MoGen discussed in note 4 and the reclassification of the amounts held in escrow from our Astute investment classified as a long-term asset as of June 30, 2018 to a short-term asset as of June 30, 2019 as we are expected to receive the final proceeds within the next 12 months.
Supplemental Cash Flow Information:
Supplemental cash flow information was as follows (in thousands):
|
Year Ended June 30, |
||||||||||||
|
2019 |
2018 |
2017 |
||||||||||
|
Income taxes paid |
$ | 36,814 | $ | 35,076 | $ | 42,900 | ||||||
|
Interest paid |
21,497 | 9,844 | 7,452 | |||||||||
|
Non-cash activities: |
||||||||||||
|
Acquisition-related liabilities (1) |
12,600 |
1,396 | 32,856 | |||||||||
|
|
(1) Consists of holdback payments due at future dates and liabilities for contingent consideration. Further information regarding liabilities for contingent consideration can be found in Notes 4 and 5. |
Note 4. Acquisitions:
We periodically complete business combinations that align with our business strategy. Acquisitions are accounted for using the acquisition method of accounting, which requires, among other things, that assets acquired and liabilities assumed be recognized at fair value as of the acquisition date and that the results of operations of each acquired business be included in our consolidated statements of comprehensive income from their respective dates of acquisitions. Acquisition costs are recorded in selling, general and administrative expenses as incurred.
2019 Acquisitions
Quad Technologies
On July 2, 2018, the Company acquired QT Holdings Corporation (Quad) for approximately $20.5 million, net of cash acquired, plus contingent consideration of up to $51.0 million, subject to certain product development milestones and revenue thresholds. The goodwill recorded as a result of the acquisition represents the strategic benefits of growing the Company’s product portfolio and the expected revenue growth from increased market penetration. The goodwill is not deductible for income tax purposes. The business became part of the Protein Sciences reportable segment in the first quarter of fiscal year 2019. Purchase accounting was finalized during the fourth quarter of fiscal 2019. The preliminary and final fair values of the assets acquired and liabilities assumed are as follows (in thousands):
|
Preliminary Allocation at Acquisition Date |
Adjustments to Fair Value |
Final Opening Balance Sheet Allocation |
||||||||||
|
Current assets, net of cash |
$ | 36 | $ | 36 | ||||||||
|
Equipment and other long-term assets |
284 | (56 |
) |
228 | ||||||||
|
Intangible assets: |
||||||||||||
|
Developed technology |
20,000 | (7,744 |
) |
12,256 | ||||||||
|
Goodwill |
9,790 | 4,691 | 14,481 | |||||||||
|
Total assets acquired |
30,110 | (3,109 |
) |
27,001 | ||||||||
|
Liabilities |
765 | (469 |
) |
296 | ||||||||
|
Deferred income taxes, net |
3,741 | (2,798 |
) |
943 | ||||||||
|
Net assets acquired |
$ | 25,604 | $ | 158 | $ | 25,762 | ||||||
|
Cash paid, net of cash acquired |
$ | 20,404 | $ | 58 | $ | 20,462 | ||||||
|
Fair value of contingent consideration |
5,200 | 100 | 5,300 | |||||||||
|
Net assets acquired |
$ | 25,604 | $ | 158 | $ | 25,762 | ||||||
As summarized in the table, there were adjustments totaling $4.7 million to goodwill during the measurement period. These adjustments primarily relate to refinements made to acquired intangible asset cash flow models, an update in the discount rate used in the contingent consideration calculation based on refinements made in the acquired intangible asset cash flow models, and adjustments to preliminary deferred tax amounts based on updated assessments of the applicability of certain NOLs. Tangible assets and liabilities acquired were recorded at fair value on the date of close based on management's assessment. The purchase price allocated to developed technology was estimated based on management's forecasted cash inflows and outflows using a multi-period excess earnings method to calculate the fair value of assets purchased. The developed technology asset is being amortized with the expense reflected in cost of goods sold in the Consolidated Statement of Earnings and Comprehensive Income. The amortization period for intangible assets acquired in fiscal 2019 are 14 years for developed technology. The net deferred income tax liability represents the net amount of the estimated future impact of adjustments for costs to be recognized as intangible asset amortization, which is not deductible for income tax purposes offset by the deferred tax asset for our calculation of acquired net operating losses (NOLs).
Exosome Diagnostics
On August 1, 2018, the Company acquired Exosome Diagnostics, Inc. (ExosomeDx) for approximately $251.6 million, net of cash acquired, plus contingent consideration of up to $325.0 million as follows:
● Up to $250 million if calendar year 2020 EBITA is between $45 million and $58 million or greater.
● Up to $45 million if calendar year 2022 EBITA for a new instrument product is between $54 million and $70 million or greater.
● Up to $30 million if calendar year 2022 EBITA for the remaining business is between $150 million and $190 million or greater.
The goodwill recorded as a result of the acquisition represents the strategic benefits of growing the Company’ product portfolio and the expected revenue growth from increased market penetration. The goodwill is not deductible for income tax purposes. The business became part of the Diagnostics and Genomics reportable segment in the first quarter of fiscal year 2019. Purchase accounting was finalized during the fourth quarter of fiscal 2019. The preliminary and final fair values of the assets acquired and liabilities assumed are as follows (in thousands):
|
Preliminary Allocation at Acquisition Date |
Adjustments to Fair Value |
Final Opening Balance Sheet Allocation |
||||||||||
|
Current assets, net of cash |
$ |
5,118 |
(2,507 |
) |
$ |
2,611 |
||||||
|
Equipment and other long-term assets |
2,212 |
- |
2,212 |
|||||||||
|
Intangible assets: |
||||||||||||
|
Developed technology |
180,000 |
(75,000 |
) |
105,000 |
||||||||
|
Trade name |
- |
58,000 |
58,000 |
|||||||||
|
Customer relationships |
- |
2,300 |
2,300 |
|||||||||
|
Goodwill |
96,592 |
8,770 |
105,362 |
|||||||||
|
Total assets acquired |
283,922 |
(8,437 |
) |
275,485 |
||||||||
|
Liabilities |
2,624 |
1,092 |
3,716 |
|||||||||
|
Deferred income taxes, net |
27,673 |
(11,327 |
) |
16,346 |
||||||||
|
Net assets acquired |
$ |
253,625 |
$ |
1,798 |
$ |
255,423 |
||||||
|
Cash paid, net of cash acquired |
$ |
251,825 |
$ |
(202 |
) |
$ |
251,623 |
|||||
|
Fair value of contingent consideration |
1,800 |
2,000 |
3,800 |
|||||||||
|
Net assets acquired |
$ |
253,625 |
$ |
1,798 |
$ |
255,423 |
||||||
As summarized in the table, there were adjustments totaling $8.8 million to goodwill during the measurement period. As previously disclosed, the intangible value associated with the ExosomeDx trade name and determination of the related estimated useful life was under assessment as part of purchase accounting review. During the period, the Company updated our intangible assessment to include a $58.0 million value for the ExosomeDx trade name. Due to our updated assessments and further refinements in our intangible asset cash flow models, the fair value of the developed technology intangible asset decreased by $75.0 million. When applying our final assumptions in our intangible asset cash flow models to the Company's contingent consideration recorded in the Opening Balance Sheet, the estimated contingent consideration increased by $2.0 million. Additionally, we recorded a Customer Relationships intangible asset of $2.3 million for the established physician network ordering ExosomeDx laboratory services that existed at the acquisition date. Adjustments to the opening balance sheet fair value also included updates to preliminary deferred tax amounts and working capital adjustments, primarily attributable to updates for the net realizable value of certain acquired receivables based on factors existing on the acquisition date.
Tangible assets and liabilities acquired were recorded at fair value on the date of close based on management's assessment. The purchase price allocated to developed technology, trade names, and customer relationships was based on management's forecasted cash inflows and outflows and using either a relief-from-royalty or a multiperiod excess earnings method to calculate the fair value of assets purchased. The preliminary amount recorded for developed technology is being amortized with the expense reflected in cost of goods sold in the Condensed Consolidated Statement of Earnings and Comprehensive Income. Preliminary amortization expense related to trade names, and customer relationships is reflected in selling, general and administrative expenses in the Consolidated Statement of Earnings and Comprehensive Income. The preliminary amortization periods for intangible assets acquired in fiscal 2019 are 15 years for developed technology and trade names, and 14 years for customer relationships. The net deferred income tax liability represents the net amount of the estimated future impact of adjustments for costs to be recognized as intangible asset amortization, which is not deductible for income tax purposes offset by the deferred tax asset for the preliminary calculation of acquired NOLs.
B-MoGen Biotechnologies
On June 4, 2019, the Company acquired the remaining interest in B-MoGen Biotechnologies Inc. (B-MoGen) for approximately $17.5 million, net of cash acquired, plus contingent consideration of up to $38.0 million, subject to certain product development milestones and revenue thresholds. The Company previously held an investment of $1.4 million in B-MoGen and recognized a gain of approximately $3.7 million on the transaction within other non-operating income in the consolidated statements of earnings and comprehensive income representing the adjustment of our historical investment to its fair value. The goodwill recorded as a result of the acquisition represents the strategic benefits of growing the Company’s product portfolio and the expected revenue growth from increased market penetration. The goodwill is not deductible for income tax purposes. The business became part of the Protein Sciences reportable segment in the fourth quarter of fiscal year 2019.
Certain estimated fair values are not yet finalized and are subject to change, which could be significant. The Company expects to finalize our purchasing accounting by the end of the second quarter of fiscal year 2020 when we have completed our assessment of the working capital adjustment and we have finalized our income tax assessment of acquired net operating losses (NOLs) with the completion of the stub period tax returns. Amounts for acquired current assets and liabilities, deferred tax liabilities, acquired NOLs, and goodwill also remain subject to change. The preliminary estimated fair values of the assets acquired and liabilities assumed are as follows (in thousands):
|
Preliminary Allocation at Acquisition Date |
||||
|
Current assets, net of cash |
$ | 504 | ||
|
Equipment and other long-term assets |
269 | |||
|
Intangible assets: |
||||
|
Developed technology |
14,000 | |||
| Customer relationships | 400 | |||
|
Goodwill |
16,457 | |||
|
Total assets acquired |
31,630 | |||
|
Liabilities |
211 | |||
|
Deferred income taxes, net |
3,377 | |||
|
Net assets acquired |
$ | 28,042 | ||
|
Cash paid, net of cash acquired |
$ | 17,448 | ||
|
Fair value of contingent consideration |
5,500 | |||
| Fair value of historical investment in B-MoGen | 5,094 | |||
|
Net assets acquired |
$ | 28,042 | ||
Tangible assets and liabilities acquired were recorded at fair value on the date of close based on management's assessment. The purchase price allocated to developed technology was estimated based on management's forecasted cash inflows and outflows and using a multi-period excess earnings method to calculate the fair value of assets purchased. The preliminary amount recorded for developed technology is being amortized with the expense reflected in cost of goods sold in the Consolidated Statement of Earnings and Comprehensive Income. The amortization periods for intangible assets acquired in fiscal 2019 are estimated to be 14 years for developed technology. The net deferred income tax liability represents the net amount of the estimated future impact of adjustments for costs to be recognized as intangible asset amortization, which is not deductible for income tax purposes offset by the deferred tax asset for the preliminary calculation of acquired NOLs.
2018 Acquisitions
Trevigen
On September 5, 2017 the Company acquired the stock of Trevigen Inc. for approximately $10.6 million, net of cash received. The Company has had a long-standing business relationship with Trevigen as a distributor of its product line. The goodwill recorded as a result of the acquisition represents the strategic benefits of growing the Company’s product portfolio and the expected revenue growth from increased market penetration. The goodwill is not deductible for income tax purposes. The business became part of the Protein Sciences reportable segment in the first quarter of fiscal 2018.
Atlanta Biologicals
On January 2, 2018 the Company acquired the stock of Atlanta Biologicals, Inc. and its affiliated company, Scientific Ventures, Inc., for approximately $51.3 million, net of cash acquired. The transaction was financed through available cash on hand and an additional draw from the Company’s line-of-credit. Atlanta Biologicals fetal bovine serum (FBS) product line strengthens and complements our current tissue culture reagents offering and furthers our efforts to provide more complete solutions to our research customers. The goodwill recorded as a result of the acquisition represents the strategic benefits of growing the Company’s product portfolio and the expected revenue growth from increased market penetration. The goodwill is not deductible for income tax purposes. The business became part of the Protein Sciences reportable segment in the third quarter of fiscal 2018. Purchase accounting was finalized during fiscal 2018.
Tangible assets acquired in the acquisition, net of liabilities assumed, were recorded at fair value on the date of close based on management's assessment. The purchase price allocated to developed technology, trade names, and customer relationships was based on management's forecasted cash inflows and outflows and using a relief-from-royalty and a multi-period excess earnings method to calculate the fair value of assets purchased. The developed technology is being amortized with the expense reflected in cost of goods sold in the Consolidated Statement of Earnings and Comprehensive Income. Amortization expense related to trade names, and customer relationships is reflected in selling, general and administrative expenses in the Consolidated Statement of Earnings and Comprehensive Income. The amortization periods for intangible assets acquired in fiscal 2018 are 13 years for developed technology, 12 years for customer relationships, and 15 years for trade names. The deferred income tax liability represents the net amount of the estimated future impact of adjustments for costs to be recognized upon the sale of acquired inventory that was written up to fair value and intangible asset amortization, both of which are not deductible for income tax purposes.
Eurocell Diagnostics
On February 1, 2018, the Company acquired Eurocell Diagnostics SAS, a company based in Rennes, France, for approximately $7.3 million, net of cash acquired. The Company paid $6.0 million on the acquisition date and the remaining $1.3 million was paid on February 1, 2019. The Company has had a long-standing business relationship with Eurocell as a distributor of its product line. Eurocell sells directly to the laboratory markets in the French region as well as servicing the EMEA markets via a network of distributors. The transaction was financed through cash on hand. The primary asset in this acquisition is the customer relationships; however, the acquisition resulted in some goodwill as we expect strategic benefits of revenue growth from increased market penetration. The goodwill is not deductible for income tax purposes. The business became part of the Company’s Diagnostics and Genomics reportable segment in the third quarter of fiscal 2018. Purchase accounting was finalized during fiscal 2018.
Tangible assets acquired, net of liabilities assumed, were recorded at fair value on the date of close based on management's assessment. The purchase price allocated to customer relationships was based on management's forecasted cash inflows and outflows using a multi-period excess earnings method to calculate the fair value of assets purchased. Amortization expense related customer relationships is reflected in selling, general and administrative expenses in the Consolidated Statement of Earnings and Comprehensive Income. The amortization period for customer relationships acquired in fiscal 2018 is 7 years. The deferred income tax liability represents the net amount of the estimated future impact of intangible asset amortization, which is not deductible for income tax purposes.
2017 Acquisitions
Advanced Cell Diagnostics (ACD)
On August 1, 2016, the Company acquired ACD for approximately $258.0 million, net of cash acquired, plus contingent consideration of up to $75.0 million as follows:
|
● |
$25.0 million if calendar year 2016 revenues equal or exceed $30.0 million. |
|
● |
an additional $50.0 million if calendar year 2017 revenues equal or exceed $45.0 million. |
The Company paid approximately $247.0 million, net of cash acquired and the working capital adjustments, as of the acquisition date. The remaining $11.0 million was paid to current employees who held ACD unvested stock as of the acquisition date. In order to receive payment for unvested shares, the individuals had to remain employees of ACD over an 18-month vesting period which extended from the acquisition date through March 31, 2018. Any amounts that would have been owed to individuals who left the company during the vesting period was pooled together and distributed amongst the other former ACD shareholders at the end of the vesting period. Management determined that $3.6 million of the $11.0 million represented purchase price consideration paid for pre-acquisition services. However, the remaining $7.4 million represented compensation expense as the amount the individual employees received was tied to future service. This liability recorded on the Consolidated Balance Sheets under the caption “Salaries, wages and related accruals” for the fiscal year ended June 30, 2017.
During the third quarter of fiscal 2017, management determined that the calendar year 2016 revenue milestone was met. During the third quarter of fiscal 2018, management determined that the calendar year 2017 revenue milestone was met. Refer to Note 4 for discussion of this item as well as discussion of the changes to the fair value estimate for the calendar year revenue milestones as of June 30, 2018 and 2017.
The goodwill recorded as a result of the ACD acquisition represents the strategic benefits of growing the Company's product portfolio and the expected revenue growth from increased market penetration from future products and customers. The goodwill is not deductible for income tax purposes. The business became part of the Company’s Biotechnology reportable segment in the first quarter of 2017.
As previously disclosed, ACD was acquired on August 1, 2016. The unaudited pro forma financial information below summarizes the combined results of operations for Bio-Techne and ACD as though the companies were combined as of the beginning fiscal 2016. The pro forma financial information for all periods presented includes the purchase accounting effects resulting from these acquisitions except for the increase in inventory to fair value and the fair value adjustments to contingent consideration as these are not expected to have a continuing impact on cost of goods sold or selling, general and administrative expense, respectively. The pro forma financial information as presented below is for informational purposes only and is not indicative of the results of operations that would have been achieved if the acquisitions had taken place at the beginning of fiscal 2016.
|
Year Ended |
||||||||
|
June 30, |
||||||||
|
2017 |
2016 |
|||||||
|
Net sales |
$ |
564,220 |
$ |
523,840 |
||||
|
Net income |
99,380 |
110,536 |
||||||
Space Import-Export, Srl
On July 1, 2016, the Company acquired Space Import-Export, Srl (Space) of Milan, Italy for approximately $9.0 million. $6.7 million was paid on the acquisition date and the remaining $2.3 million was paid during the first quarter of fiscal year 2018. Space was a long-time distribution partner of the Company in the Italian market. The acquisition resulted in goodwill as we expect strategic benefits of revenue growth from increased market penetration. The goodwill is not deductible for income tax purposes. The business became part of the Company’s Biotechnology reportable segment in the first quarter of 2017.
Tangible assets acquired, net of liabilities assumed, were stated at fair value at the date of acquisition based on management's assessment. The purchase price allocated to developed technology, trade names, non-compete agreements and customer relationships was based on management's forecasted cash inflows and outflows and using a relief-from-royalty and a multi-period excess earnings method to calculate the fair value of assets purchased. The developed technology is being amortized with the expense reflected in cost of goods sold in the Consolidated Statements of Earnings and Comprehensive Income. Amortization expense related to trade names, the non-compete agreement and customer relationships is reflected in selling, general and administrative expenses in the Consolidated Statements of Earnings and Comprehensive Income. The deferred income tax liability represents the estimated future impact of adjustments for the cost to be recognized upon the sale of acquired inventory that was written up to fair value and intangible asset amortization, both of which are not deductible for income tax purposes, and the future tax benefit of net operating loss and tax credit carryforwards which will be deductible by the Company in future periods.
The aggregate purchase price of the acquisitions was allocated to the assets acquired and liabilities assumed based on their estimated fair values as of the acquisition date. The following table summarizes the estimated fair values of the assets acquired and liabilities assumed as a result of the fiscal year 2018 and 2017 acquisitions (in thousands):
| Trevigen | Atlanta Biologicals |
Eurocell Diagnostics |
ACD |
Space |
||||||||||||||
|
Current assets, net of cash |
$ | 1,662 | $ | 15,722 | $ | 512 | $ | 15,824 | $ | 2,128 | ||||||||
|
Equipment and other long-term assets |
53 | 4,901 | 188 | 6,569 | 159 | |||||||||||||
|
Intangible assets: |
||||||||||||||||||
| Developed technology | 5,100 | 23,000 | - | 150,000 | - | |||||||||||||
| Trade name | 160 | 2,300 | - | 21,900 | - | |||||||||||||
|
Customer relationships |
260 | 3,600 | 6,272 | 6,300 | 6,769 | |||||||||||||
|
Goodwill |
5,991 | 10,195 | 2,910 | 143,967 | 3,517 | |||||||||||||
|
Total assets acquired |
13,226 | 59,718 | 9,882 | 344,560 | 12,573 | |||||||||||||
|
Liabilities |
387 | 90 | 483 | 4,179 | 1,445 | |||||||||||||
|
Deferred income taxes, net |
2,195 | 8,354 | 2,070 | 52,743 | 2,125 | |||||||||||||
|
Net assets acquired |
$ | 10,644 | $ | 51,274 | $ | 7,329 | $ | 287,638 | $ | 9,003 | ||||||||
|
Cash paid, net of cash acquired |
10,644 | 51,274 | $ | 5,933 | $ | 247,038 | $ | 6,747 | ||||||||||
|
Consideration payable |
- | - | 1,396 | 3,600 | 2,256 | |||||||||||||
| Contingent consideration payable | - | - | - | 37,000 | - | |||||||||||||
| Net assets acquired | $ | 10,644 | $ | 51,274 | $ | 7,329 | $ | 287,638 | $ | 9,003 | ||||||||
Tangible assets acquired, net of liabilities assumed, were stated at fair value at the date of acquisition based on management's assessment. The purchase price allocated to developed technology, trade names, non-compete agreements and customer relationships was based on management's forecasted cash inflows and outflows and using a relief-from-royalty and multi-period excess earnings method to calculate the fair value of assets purchased. The developed technology is being amortized with the expense reflected in cost of good sold in the Consolidated Statements of Earnings and Comprehensive Income. Amortization expense related to trade names, the non-compete agreement and customer relationships is reflected in selling, general and administrative expenses in the Consolidated Statements of Earnings and Comprehensive Income. The deferred income tax liability represents the estimated future impact of adjustments for the cost to be recognized upon the sale of acquired inventory that was written up to fair value and intangible asset amortization, both of which are not deductible for income tax purposes, and the future tax benefit of net operating loss and tax credit carryforwards which will be deductible by the Company in future periods.
Note 5. Fair Value Measurements:
The Company’s financial instruments include cash and cash equivalents, available for sale investments, accounts receivable, accounts payable, contingent consideration obligations, derivative instruments, and long-term debt.
Fair value is defined as the amount that would be received to sell an asset or paid to transfer a liability in an orderly transaction between market participants as of the measurement date. This standard also establishes a hierarchy for inputs used in measuring fair value. This standard maximizes the use of observable inputs and minimizes the use of unobservable inputs by requiring that the most observable inputs be used when available. Observable inputs are inputs market participants would use in valuing the asset or liability based on market data obtained from independent sources. Unobservable inputs are inputs that reflect our assumptions about the factors market participants would use in valuing the asset or liability based upon the best information available in the circumstances.
The categorization of financial assets and liabilities within the valuation hierarchy is based upon the lowest level of input that is significant to the fair value measurement. The hierarchy is broken down into three levels. Level 1 inputs are quoted prices in active markets for identical assets or liabilities. Level 2 inputs include quoted prices for similar assets or liabilities in active markets, quoted prices for identical or similar assets or liabilities in markets that are not active, and inputs (other than quoted prices) that are observable for the asset or liability, either directly or indirectly. Level 3 inputs are unobservable for the asset or liability and their fair values are determined using pricing models, discounted cash flow methodologies or similar techniques and at least one significant model assumption or input is unobservable. Level 3 may also include certain investment securities for which there is limited market activity or a decrease in the observability of market pricing for the investments, such that the determination of fair value requires significant judgment or estimation.
The following tables provide information by level for financial assets and liabilities that are measured at fair value on a recurring basis (in thousands):
|
Total carrying value as of |
Fair Value Measurements Using Inputs Considered as |
|||||||||||||||
|
June 30, 2019 |
Level 1 |
Level 2 |
Level 3 |
|||||||||||||
|
Assets |
||||||||||||||||
|
Equity securities (1) |
$ | 38,219 | $ | 38,219 | $ | - | $ | - | ||||||||
|
Certificates of deposit (2) |
26,928 | 26,928 | - | - | ||||||||||||
|
Total Assets |
$ | 65,147 | $ | 65,147 | $ | - | $ | - | ||||||||
|
Liabilities |
||||||||||||||||
|
Contingent consideration |
$ | 12,600 | $ | - | $ | - | $ | 12,600 | ||||||||
| Derivative instruments - cash flow hedges | 12,458 | - | 12,458 | - | ||||||||||||
| Total Liabilities | $ | 25,058 | $ | - | $ | 12,458 | $ | 12,600 | ||||||||
|
Total carrying value as of |
Fair Value Measurements Using Inputs Considered as |
|||||||||||||||
|
June 30, 2018 |
Level 1 |
Level 2 |
Level 3 |
|||||||||||||
|
Assets |
||||||||||||||||
|
Equity securities (1) |
$ | 54,286 | $ | 54,286 | $ | - | $ | - | ||||||||
|
Certificates of deposit (2) |
5,478 | 5,478 | - | - | ||||||||||||
|
Total Assets |
$ | 59,764 | $ | 59,764 | $ | - | $ | - | ||||||||
|
Liabilities |
||||||||||||||||
|
Contingent consideration |
$ | - | $ | - | $ | - | $ | - | ||||||||
|
(1) Included in available-for-sale investments on the balance sheet. The cost basis in the Company's investment in CCXI at June 30, 2019 and June 30, 2018 was $18.8 million. |
|
| (2) Included in available-for-sale investments on the balance sheet. The certificate of deposits have contractual maturity dates within one year. |
Fair value measurements of available for sale securities
Our available for sale securities are measured at fair value using quoted market prices in active markets for identical assets and are therefore classified as Level 1 assets.
Fair value measurements of derivative instruments
In October 2018, the Company entered into forward starting swaps designated as cash flow hedges on outstanding debt. The forward starting swaps reduce the variability of cash flow payments for the Company by converting the variable interest rate on the Company’s long-term debt described in Note 6 to that of a fixed interest rate. Accordingly, as part of the forward starting swaps, the Company will exchange, at specified intervals, the difference between floating and fixed interest amounts based on $380 million of notional principal amount. The change in the fair value of the instrument is reported as a component of other comprehensive income and reclassified into interest expense over the corresponding term of the cash flow hedge. The Company did not reclassify any amounts out of other comprehensive income into interest expense during the fiscal year ended June 30, 2019. The liability related to the derivative instrument was recorded within Other long-term liabilities on the Consolidated Balance Sheet. The instrument was valued using observable market inputs in active markets and therefore classified as a Level 2 liability.
Fair value measurements of contingent consideration
In connection with the ExosomeDx, Quad, and B-Mogen acquisitions the Company is required to make contingent consideration payments of up to $325.0 million, $51.0 million, and $38.0 million respectively. The contingent consideration payments are subject to ExosomeDx achieving certain EBITA thresholds, Quad meeting certain product development milestones and revenue thresholds, and B-Mogen meeting certain product development milestones and revenue thresholds. The preliminary fair value of the liabilities for the contingent payments recognized upon the acquisition as part of the purchase accounting opening balance sheet totaled $14.6 million ($3.8 million for ExosomeDx, $5.3 million for Quad, and $5.5 million for B-Mogen) as discussed in Note 4. The preliminary fair value of the development milestone payments was estimated by discounting the probability-weighted contingent payments expected to be made to present value. Assumptions used in these calculations were probability of success, duration of the earn-out, and discount rate. The preliminary fair value for the EBITA and revenue milestone payments was determined using a Monte Carlo simulation-based model discounted to present value. Assumptions used in these calculations are units sold, expected revenue, expected expenses, discount rate and various probability factors. The ultimate settlement of contingent consideration could deviate from current estimates based on the actual results of these financial measures. This liability is considered to be a Level 3 financial liability that is re-measured each reporting period. The change in fair value of contingent consideration for these acquisitions is included in general and administrative expense.
In fiscal 2018, the Company made $88.5 million in cash payments towards the ACD, CyVek and Zephyrus contingent consideration liabilities after it determined certain sales and revenue thresholds were met. Of the $88.5 million in total payments, $61.9 million is classified as financing on the statement of cash flows. The remaining $26.6 million is recorded as operating on the statement of cash flows as it represents the consideration liability that exceeds the amount of the contingent consideration liability recognized at the acquisition date.
The following table presents a reconciliation of the liability measured at fair value on a recurring basis using significant unobservable inputs (Level 3) (in thousands):
|
June 30, |
||||||||
|
2019 |
2018 |
|||||||
|
Fair value at the beginning of period |
$ | - | $ | 68,400 | ||||
|
Purchase price contingent consideration (Note 4) |
14,600 | - | ||||||
|
Payments |
- |
|
(88,500 |
) |
||||
|
Change in fair value of contingent consideration |
(2,000 | ) | 20,100 | |||||
|
Contingent consideration payable |
$ | 12,600 | $ | - | ||||
Fair value measurements of other financial instruments – The following methods and assumptions were used to estimate the fair value of each class of financial instrument for which it is practicable to estimate fair value.
Cash and cash equivalents, certificates of deposit, accounts receivable, and accounts payable – The carrying amounts reported in the consolidated balance sheets approximate fair value because of the short-term nature of these items.
Long-term debt – The carrying amounts reported in the consolidated balance sheets for the amount drawn on our line-of-credit facility approximates fair value because our interest rate is variable and reflects current market rates.
Note 6. Debt and Other Financing Arrangements:
On August 1, 2018, the Company entered into a new uncollateralized revolving line-of-credit and term loan governed by a Credit Agreement (the Credit Agreement). The Credit Agreement provides for a revolving credit facility of $600.0 million, which can be increased by an additional $200.0 million subject to certain conditions, and a term loan of $250.0 million. Borrowings under the Credit Agreement may be used for working capital and expenditures of the Company and its subsidiaries, including financing permitted acquisitions. Borrowings under the Credit Agreement bear interest at a variable rate. The current outstanding debt is based on the Eurodollar Loans term for which the interest rate is calculated as the sum of LIBOR plus an applicable margin. The applicable margin is determined for the total leverage ratio of the Company and updated on a quarterly basis. The annualized fee for any unused portion of the credit facility is currently 20 basis points. The Company has recorded $12.5 million of our outstanding borrowings under the Credit Agreement as a current liability in our Consolidated Balance sheet, which represents our required quarterly debt payments to be made in fiscal year 2020.
The Credit Agreement matures on August 1, 2023 and contains customary restrictive and financial covenants and customary events of default. At the closing on August 1, 2018 the company borrowed $250.0 million under the term loan and $330.0 million under the revolving credit facility. As of June 30, 2019, the outstanding balance under the Credit Agreement was $505.2 million.
Note 7. Commitments and Contingencies:
The Company leases office and warehouse space, vehicles and various office equipment under operating leases. At June 30, 2019, aggregate net minimum rental commitments under non-cancelable leases having an initial or remaining term of more than one year are payable as follows (in thousands):
|
2020 |
$ | 13,707 | ||
|
2021 |
13,469 | |||
|
2022 |
13,154 | |||
|
2023 |
12,716 | |||
|
2024 |
11,392 | |||
|
Thereafter |
51,895 | |||
|
Total |
$ | 116,333 |
Total rent expense was approximately $12.9 million, $10.8 million, and $9.8 million for the years ended June 30, 2019, 2018, and 2017, respectively.
The Company is routinely subject to claims and involved in legal actions which are incidental to the business of the Company. Although it is difficult to predict the ultimate outcome of these matters, management believes that any ultimate liability will not materially affect the consolidated financial position or results of operations of the Company.
Note 8. Supplemental Equity and Accumulated Other Comprehensive Income (loss):
Supplemental Equity
The Company has declared cash dividends per share of $1.28 in each of the full fiscal years ended June 30, 2019, June 30, 2018, and June 30, 2017. During the year ended June 30, 2019, the Company repurchased 95,000 shares at an average share price of $162.15. During fiscal 2019, the Company made the accounting policy election to record the portion of share repurchases in excess of the par value entirely in retained earnings.
Accumulated Other Comprehensive Income (loss)
Changes in accumulated other comprehensive income (loss), net of tax, at June 30 consists of (in thousands):
|
Unrealized Gains (Losses) on Available- for-Sale Investments |
Foreign Currency Translation Adjustments |
Unrealized Gains (Losses) on Derivatives Instruments |
Total |
|||||||||||||
|
Balance June 30, 2016 |
$ | (5,542 |
) |
(64,863 |
) |
- | $ | (70,405 |
) |
|||||||
|
Other comprehensive income (loss) before reclassifications |
24,531 | (3,061 |
) |
- | 21,470 | |||||||||||
|
Balance June 30, 2017 |
$ | 18,989 | (67,924 |
) |
- | $ | (48,935 |
) |
||||||||
|
Other comprehensive income (loss) before reclassifications |
18,108 | (1,572 |
) |
- | 16,536 | |||||||||||
|
Amounts reclassified from accumulated other comprehensive loss to income |
(12,415 |
) |
- | - | (12,415 |
) |
||||||||||
|
Balance June 30, 2018 |
$ | 24,682 | (69,496 |
) |
- | $ | (44,814 |
) |
||||||||
| Cumulative effect adjustment for adoption for ASU 2018-02(1) | 2,371 | - | - | 2,371 | ||||||||||||
| Cumulative effect adjustment for adoption for ASU 2016-01(1) | (27,053 | ) | - | - | (27,053 | ) | ||||||||||
|
Other comprehensive income (loss) before reclassifications (2) |
- | (4,487 | ) | (9,537 | ) | (14,024 | ) | |||||||||
|
Balance June 30, 2019 |
$ | - | (73,983 |
) |
(9,537 | ) | $ | (83,521 |
) |
|||||||
(1)See Note 1 for further information related to the adoption of ASU 2016-01 and 2018-02.
(2) The gain (loss) on the forward starting interest rate swap will be reclassified into earnings beginning October 31, 2019. Approximately ($1,748) of the ($9,537) will be reclassified into earnings in the 12 months subsequent to June 30, 2019.
Note 9. Earnings Per Share:
The following table reflects the calculation of basic and diluted earnings per share (in thousands, except per share amounts):
|
Year Ended June 30, |
||||||||||||
|
2019 |
2018 |
2017 |
||||||||||
|
Earnings per share – basic: |
||||||||||||
|
Net income |
$ | 96,072 | $ | 126,150 | $ | 76,086 | ||||||
|
Income allocated to participating securities |
(105 |
) |
(108 |
) |
(65 |
) |
||||||
|
Income available to common shareholders |
$ | 95,967 | $ | 126,042 | $ | 76,021 | ||||||
|
Weighted-average shares outstanding – basic |
37,781 | 37,476 | 37,313 | |||||||||
|
Earnings per share – basic |
$ | 2.54 | $ | 3.36 | $ | 2.04 | ||||||
|
Earnings per share – diluted: |
||||||||||||
|
Net income |
$ | 96,072 | $ | 126,150 | $ | 76,086 | ||||||
|
Income allocated to participating securities |
(105 |
) |
(108 |
) |
(65 |
) |
||||||
|
Income available to common shareholders |
$ | 95,967 | $ | 126,042 | $ | 76,021 | ||||||
|
Weighted-average shares outstanding – basic |
37,781 | 37,476 | 37,313 | |||||||||
|
Dilutive effect of stock options and restricted stock units |
1,111 | 579 | 187 | |||||||||
|
Weighted-average common shares outstanding – diluted |
38,892 | 38,055 | 37,500 | |||||||||
|
Earnings per share – diluted |
$ | 2.47 | $ | 3.31 | $ | 2.03 | ||||||
Basic net income per common share is calculated based on the weighted average number of common shares outstanding during the period. Diluted net income per common share is computed by dividing net income by the weighted average number of common and potentially dilutive common shares outstanding during the period. Potentially dilutive common shares of our stock result from dilutive common stock options and restricted stock units. We use the treasury stock method to calculate the weighted-average shares used in the diluted earnings per share computation. Under the treasury stock method, the proceeds from exercise of an option, the amount of compensation cost, if any, for future service that we have not yet recognized, and the amount of estimated tax benefits that would be recorded in paid-in capital, if any, when the option is exercised are assumed to be used to repurchase shares in the current period.
The dilutive effect of stock options in the above table excludes all options for which the aggregate exercise proceeds exceeded the average market price for the period. The number of potentially dilutive option shares excluded from the calculation was 1.3 million, 0.9 million, and 2.0 million for the fiscal years ended June 30, 2019, 2018 and 2017, respectively.
Note 10. Share-based Compensation and Other Benefit Plans:
The cost of employee services received in exchange for the award of equity instruments is based on the fair value of the award at the date of grant. Compensation cost is recognized using a straight-line method over the vesting period and is net of estimated forfeitures. Stock option exercises and stock awards are satisfied through the issuance of new shares.
Equity incentive plan: The Company's Second Amended and Restated 2010 Equity Incentive Plan (the Second A&R 2010 Plan) provides for the granting of incentive and nonqualified stock options, restricted stock, restricted stock units, performance shares, performance units and stock appreciation rights. There are 7.5 million shares of common stock authorized for grant under the Second A&R 2010 Plan. At June 30, 2019, there were 2.6 million shares of common stock available for grant under the Second A&R 2010 Plan. The maximum term of incentive options granted under the Second A&R 2010 Plan is ten years. The Second A&R 2010 Plan amended and restated the Company's Amended and Restate 2010 Equity Incentive Plan (the A&R 2010 Plan). The A&R 2010 Plan replaced the Company's 1998 Nonqualified Stock Option Plan (the 1998 Plan). The Second A&R 2010 Plan and the 1998 Plan (collectively, the Plans) are administered by the Board of Directors and its Executive Compensation Committee, which determine the persons who are to receive awards under the Plans, the number of shares subject to each award and the term and exercise price of each award. The number of shares of common stock subject to outstanding awards as of June 30, 2019 under the Second A&R 2010 Plan and the 1998 Plan were 3.6 million and 20,000, respectively. On April 26, 2018 the Compensation Committee of the Board of Directors approved a modification to the Equity Incentive Plan. The modification implements a new retirement policy that permits retirees to continue vesting in certain time-based stock options granted during employment, resulting in accelerated stock compensation expense for those employees meeting the definition of retirement eligible. This modification resulted in an additional $8.3 million of expense during fiscal year 2018 and affected all employees who participate in the plan.
The fair values of options granted under the Plans were estimated on the date of grant using the Black-Scholes option-pricing model with the following assumptions used:
|
Year Ended June 30, |
|||||||||||||||
|
2019 |
2018 |
2017 |
|||||||||||||
|
Dividend yield |
0.74% | 1.1% | 1.2% | ||||||||||||
|
Expected volatility |
20% | - | 23% | 20% | - | 21% | 21% | - | 24% | ||||||
|
Risk-free interest rates |
2.5% | - | 3.0% | 1.7% | - | 2.8% | 1.0% | - | 1.9% | ||||||
|
Expected lives (years) |
4.1 | 4.7 | 4.7 | ||||||||||||
The dividend yield is based on the Company's historical annual cash dividend divided by the market value of the Company's common stock. The expected annualized volatility is based on the Company's historical stock price over a period equivalent to the expected life of the option granted. The risk-free interest rate is based on U.S. Treasury constant maturity interest rates with a term consistent with the expected life of the options granted.
Stock option activity under the Plans for the three years ended June 30, 2019, consists of the following (shares in thousands):
|
Number of Shares (in thousands) |
Weighted |
Aggregate (millions) |
Weighted Average Contractual Life (years) |
|||||||||||||
|
Outstanding at June 30, 2016 |
1,819 | $ | 91.91 | |||||||||||||
|
Granted |
1,135 | 107.42 | ||||||||||||||
|
Forfeited |
(70 |
) |
99.11 | |||||||||||||
|
Exercised |
(63 |
) |
71.81 | |||||||||||||
|
Outstanding at June 30, 2017 |
2,821 | $ | 98.42 | |||||||||||||
|
Granted |
1,087 | 120.67 | ||||||||||||||
|
Forfeited |
(252 |
) |
86.62 | |||||||||||||
|
Exercised |
(204 |
) |
111.51 | |||||||||||||
|
Outstanding at June 30, 2018 |
3,452 | $ | 105.17 | |||||||||||||
|
Granted |
917 | 173.89 | ||||||||||||||
|
Forfeited |
(330 |
) |
129.93 | |||||||||||||
|
Exercised |
(383 |
) |
95.29 | |||||||||||||
|
Outstanding at June 30, 2019 |
3,656 | $ | 121.16 | $ | 319.3 | 4.45 | ||||||||||
|
Exercisable at June 30, 2017: |
843 | 82.93 | ||||||||||||||
|
Exercisable at June 30, 2018: |
1,151 | 90.75 | ||||||||||||||
|
Exercisable at June 30, 2019: |
1,467 | 98.70 | $ | 161 | 3.33 | |||||||||||
The weighted average fair value of options granted during fiscal 2019, 2018 and 2017 was $34.66, $22.07 and $18.21 respectively. The total intrinsic value of options exercised during fiscal 2019, 2018 and 2017 were $159.0 million, $10.6 million, and $2.3 million respectively. The total fair value of options vested during fiscal 2019, 2018 and 2017 were $31.7 million, $8.8 million, and $5.0 million respectively.
Restricted common stock activity under the Plans for the three years ended June 30, 2019, consists of the following (units in thousands):
|
Number of Shares (in thousands) |
Weighted Average Grant Date Fair Value |
Weighted Average Remaining Contractual Term (years) |
||||||||||
|
Unvested at June 30, 2016 |
23 | $ | 98.03 | |||||||||
|
Granted |
24 | 104.94 | ||||||||||
|
Vested |
(15 |
) |
92.62 | |||||||||
|
Forfeited |
- | - | ||||||||||
|
Unvested at June 30, 2017 |
32 | $ | 105.80 | |||||||||
|
Granted |
20 | 125.05 | ||||||||||
|
Vested |
(17 |
) |
104.66 | |||||||||
|
Forfeited |
- | - | ||||||||||
|
Unvested at June 30, 2018 |
35 | $ |
117.39 |
|||||||||
|
Granted |
15 | 177.93 | ||||||||||
|
Vested |
(20 |
) |
116.76 | |||||||||
|
Forfeited |
- | - | ||||||||||
|
Unvested at June 30, 2019 |
30 | $ | 117.39 | 5.88 | ||||||||
The total fair value of restricted shares that vested was $2.3 million for fiscal 2019, $1.7 million for fiscal 2018, and $1.4 million for fiscal 2017.
Restricted stock unit activity under the Plans for the three years ended June 30, 2019, consists of the following (units in thousands):
|
Number of Units (in thousands) |
Weighted Average Grant Date Fair Value |
Weighted Average Remaining Contractual Term (years) |
||||||||||
|
Outstanding at June 30, 2016 |
59 | $ | 100.40 | |||||||||
|
Granted |
65 | 109.36 | ||||||||||
|
Vested |
(9 |
) |
92.94 | |||||||||
|
Forfeited |
(4 |
) |
98.04 | |||||||||
|
Outstanding at June 30, 2017 |
111 | $ | 106.39 | |||||||||
|
Granted |
71 | 129.99 | ||||||||||
|
Vested |
(16 |
) |
95.46 | |||||||||
|
Forfeited |
(18 |
) |
115.01 | |||||||||
|
Outstanding at June 30, 2018 |
148 | $ | 117.95 | |||||||||
|
Granted |
56 | 170.96 | ||||||||||
|
Vested |
(28 |
) |
110.86 | |||||||||
|
Forfeited |
(36 |
) |
143.72 | |||||||||
|
Outstanding at June 30, 2019 |
139 | $ | 134.17 | 5.17 | ||||||||
The total fair value of restricted stock units that vested was $3.1 million for fiscal 2019, $1.6 million for fiscal 2018, and $0.9 million for fiscal 2017. The restricted stock units vest over a three-year period.
Stock-based compensation cost of $32.3 million, $28.2 million, and $14.6 million was included in selling, general and administrative expense in fiscal 2019, 2018 and 2017, respectively. The income tax benefit associated with stock-based compensation costs was $0.4 million and $0.5 million in fiscal 2018, and 2017, respectively. As of June 30, 2019, there was $26.6 million of unrecognized compensation cost related to non-vested stock options, non-vested restricted stock units and non-vested restricted stock which will be expensed in fiscal 2020 through 2022 using a 3% forfeiture rate. The weighted average period over which the compensation cost is expected to be recognized is 2.0 years.
Employee stock purchase plan: In fiscal year 2015, the Company established the Bio-Techne Corporation 2014 Employee Stock Purchase Plan (ESPP), which was approved by the Company's shareholders on October 30, 2014, and which is designed to comply with IRS provisions governing employee stock purchase plans. 200,000 shares were allocated to the ESPP. The Company recorded expense of $0.5 million, $0.3 million and $0.2 million expense for the ESPP in fiscal 2019, 2018 and 2017, respectively.
Profit sharing and savings plans: The Company has profit sharing and savings plans for its U.S. employees, which conform to IRS provisions for 401(k) plans. The Company makes matching contributions to the Plan. The Company has recorded an expense for contributions to the plans of $2.8 million, $2.5 million, and $2.2 million for the years ended June 30, 2019, 2018, and 2017, respectively. The Company operates defined contribution pension plans for its U.K. employees. The Company has recorded an expense for contributions to the plans of $1.4 million, $1.4, and $0.8 million for the years ended June 30, 2019, 2018 and 2017, respectively.
Performance incentive programs: In fiscal 2019, under certain employment agreements and a Management Incentive Plan available to executive officers and certain management personnel, the Company recorded cash bonuses of $9.3 million, granted options for 618,898 shares of common stock, issued 11,279 restricted common shares and 25,903 restricted stock units. In fiscal 2018 and fiscal 2017, the Company recorded cash bonuses of $7.2 million and $4.7 million, granted options for 553,750 and 896,778 shares of common stock, and issued 14,194 and 16,653 restricted common stock shares and 35,174 and 39,931 restricted stock, respectively.
Note 11. Income Taxes:
Income before income taxes was comprised of the following (in thousands):
|
Year Ended June 30, |
||||||||||||
|
2019 |
2018 |
2017 |
||||||||||
|
Domestic |
$ | 64,081 | $ | 81,557 | $ | 81,721 | ||||||
|
Foreign |
47,934 | 44,395 | 30,240 | |||||||||
|
Income before income taxes |
$ | 112,015 | $ | 125,952 | $ | 111,961 | ||||||
The provision for income taxes consisted of the following (in thousands):
|
Year Ended June 30, |
||||||||||||
|
2019 |
2018 |
2017 |
||||||||||
|
Taxes on income consist of: |
||||||||||||
|
Currently tax provision: |
||||||||||||
|
Federal |
$ | 16,090 | $ | 28,416 | $ | 28,462 | ||||||
|
State |
544 | 5,315 | 4,051 | |||||||||
|
Foreign |
13,329 | 11,983 | 8,212 | |||||||||
|
Total current tax provision |
29,963 | 45,714 | 40,725 | |||||||||
|
Deferred tax provision: |
||||||||||||
|
Federal |
(6,903 |
) |
(40,378 |
) |
(901 |
) |
||||||
|
State |
(3,977 |
) |
(1,381 |
) |
(968 |
) |
||||||
|
Foreign |
(3,142 |
) |
(4,154 |
) |
(2,981 |
) |
||||||
|
Total deferred tax provision |
(14,021 |
) |
(45,912 |
) |
(4,850 |
) |
||||||
|
Total income tax provision |
$ | 15,942 |
|
$ | (198 |
) |
$ | 35,875 | ||||
The Company’s effective income tax rate for fiscal 2019 was 14.2% vs (0.2%) in the prior year. The change in the effective tax rate for fiscal 2019 and 2018 was driven by changes in net discrete tax benefits of $12.7 million and $34.4 million for fiscal year 2019 and 2018, respectively.
In fiscal 2018, the Company recognized net discrete tax benefits of $34.4 million. The primary driver in fiscal 2018 discrete tax benefits was a discrete net tax benefit of $33.0 million related to the Tax Act (as described further below). This net tax benefit consisted of $36.5 million due to the re-measurement of the Company’s deferred tax accounts to reflect the U.S. federal corporate tax rate reduction impact to our net deferred tax balances offset by expense for the federal transition tax of $3.3 million. Also impacting the Company’s fiscal 2018 effective tax rate was a $2.2 million tax benefit related to stock option exercises offset by a net discrete tax expense of $4.2 million related to the revaluation of contingent consideration, which is not a tax deductible expense.
On December 22, 2017, the Tax Cuts and Jobs Act (the “Tax Act”) was enacted, which reduced the U.S. federal corporate tax rate from 35% to 21%, required companies to pay a one-time transition tax on earnings of certain foreign subsidiaries that were previously tax deferred and created new taxes on certain foreign sourced earnings. The Tax Act added many new provisions including changes the deduction for executive compensation, a tax on global intangible low taxed income (“GILTI”), the base erosion anti abuse tax (“BEAT”) and a deduction for foreign derived intangible income (“FDII”). The SEC staff issued Staff Accounting Bulletin (“SAB 118”) later codified as ASU 2018-05 Amendments to SEC Paragraphs Pursuant to SEC Staff Accounting Bulletin (SAB) No. 118, which provides a measurement period of up to one year from the Tax Act’s enactment date to complete the accounting for the effects of the Tax Act.
The end of the measurement period allowed under ASU 2018-05 was December 31, 2018. However, the Company anticipates additional interpretations and clarifications to be issued by the U.S. Treasury Department, which may affect future period tax calculations. The Company made the accounting policy election to treat taxes due on U.S. inclusions in taxable income related to GILTI as a current period expense when incurred.
The following is a reconciliation of the federal tax calculated at the statutory rate of to the actual income taxes provided (in thousands):
|
Year Ended June 30, |
||||||||||||
|
2019 |
2018 |
2017 |
||||||||||
|
Income tax expense at federal statutory rate |
21.0 |
% |
28.1 |
% |
35.0 |
% |
||||||
|
State income taxes, net of federal benefit |
0.8 |
% |
2.5 |
% |
1.9 |
% |
||||||
|
Qualified production activity deduction |
- |
% |
(2.4 |
)% |
(3.4 |
)% |
||||||
|
Research and development tax credit |
(1.6 |
)% |
(1.4 |
)% |
(1.4 |
)% |
||||||
|
Contingent consideration adjustment |
(0.4 | )% | 3.3 |
% |
4.1 |
% |
||||||
|
Foreign tax rate differences |
0.2 | % | (3.5 |
)% |
(4.6 |
)% |
||||||
|
Option exercises |
(5.8 | )% | (1.8 |
)% |
- |
% |
||||||
| Domestic tax legislation changes | 1.7 |
% |
(26.2 |
)% |
- |
% |
||||||
| State apportionment changes | (2.3 | )% | - | - | ||||||||
|
Other, net |
0.6 |
% |
1.2 |
% |
0.4 |
% |
||||||
|
Effective tax rate |
14.2 |
% |
(0.2 |
)% |
32.0 |
% |
||||||
Deferred taxes on the Consolidated Balance Sheets consisted of the following temporary differences (in thousands):
|
June 30 |
||||||||
|
2019 |
2018 |
|||||||
|
Inventory |
$ | 7,743 | $ | 5,873 | ||||
|
Net operating loss carryovers |
33,294 | 15,938 | ||||||
|
Tax credit carryovers |
9,640 | 7,029 | ||||||
|
Excess tax basis in equity investments |
3,433 | 2,813 | ||||||
|
Deferred compensation |
10,333 | 7,806 | ||||||
| Derivative - cash flow hedge | 2,921 | - | ||||||
|
Other |
5,207 | 3,864 | ||||||
|
Valuation allowance |
(6,974 |
) |
(2,978 |
) |
||||
|
Deferred tax assets |
65,597 | 40,345 | ||||||
|
Net unrealized gain on available-for-sale investments |
(4,542 |
) |
(8,384 |
) |
||||
|
Intangible asset amortization |
(141,998 |
) |
(111,247 |
) |
||||
|
Depreciation |
(8,371 | ) | (6,349 |
) |
||||
|
Other |
(440 | ) | (658 |
) |
||||
|
Deferred tax liabilities |
(155,351 |
) |
(126,638 |
) |
||||
|
Net deferred tax liabilities |
$ | (89,754 |
) |
$ | (86,293 |
) |
||
A deferred tax valuation allowance is required when it is more likely than not that all or a portion of deferred tax assets will not be realized. The valuation allowance as of June 30, 2019 was $7.0 million, an increase of $4.0 million from the prior year. The change was driven by an increase in the valuation allowance for the Company’s net operating loss and credit carryforwards for fiscal 2019 acquisitions.
As of June 30, 2019, the $7.0 million valuation allowance relates to certain foreign and state tax net operating loss and state credit carryforwards that existed at the date the Company acquired Quad, Exosome, ACD, Novus, ProteinSimple and CyVek as well as immaterial amounts generated after the acquisitions. The Company believes it is more likely than not that these tax carryovers will not be realized.
As of June 30, 2019, the Company has federal operating loss carryforwards of approximately $98.2 million and state operating loss carryforwards of $137.4 million from its acquisitions of Quad, Exosome, ACD, ProteinSimple and CyVek, which are not limited under IRC Section 382. As of June 30, 2019, the Company has foreign net operating loss carryforwards of $13.6 million. The net operating loss carryforwards expire between fiscal 2020 and 2035. The Company has a deferred tax asset of $28.2 million, net of the valuation allowance discussed above, related to the net operating loss carryovers. As of June 30, 2019, the Company has federal and state tax credit carryforwards of $5.2 million and $4.4 million, respectively. The federal tax credit carryforwards expire between 2028 and 2038. The majority of the state credit carryforwards have no expiry date. The Company has a deferred tax asset of $7.7 million, net of the valuation allowance discussed above, related to the tax credit carryovers.
The Company has not recognized a deferred tax liability for unremitted foreign earnings of approximately $160 million from its foreign operations because its subsidiaries have invested or will invest the undistributed earnings indefinitely. The transition tax included as part of the Tax Act resulted in the previously untaxed foreign earnings being included in the federal and state fiscal 2018 taxable income. The one-time transition tax was based on certain foreign earnings for which earnings have been previously indefinitely reinvested as well as the amount of earnings held in cash and other specified assets. No additional income taxes have been provided for cumulative unremitted foreign earnings as at this time our intention with respect to unremitted foreign earnings is to continue to indefinitely reinvest outside the U.S. those earnings needed for working capital or additional foreign investment. If there are policy changes, we would record applicable taxes at that time.
We continue to analyze our global working capital requirements and the potential tax liabilities that would be incurred if the non-U.S. subsidiaries distribute cash to the U.S. parent, which include local country withholding tax and potential U.S. state taxation. In addition, we anticipate that further guidance from the IRS and US Treasury related to the Tax Act could impact the amount of any related taxes. Therefore, it is not practical to estimate the amount of the deferred income tax liabilities related to investments in these foreign subsidiaries.
The following is a reconciliation of the beginning and ending balance of unrecognized tax benefits (in thousands):
|
Year Ended June 30, |
||||||||||||
|
2019 |
2018 |
2017 |
||||||||||
|
Beginning balance |
$ | 1,947 | $ | 1,747 | $ | 1,480 | ||||||
|
Additions due to acquisitions |
900 | 628 | ||||||||||
|
Additions for tax positions of current year |
2,185 | 35 | 13 | |||||||||
|
Closure of tax years |
(374 |
) |
||||||||||
|
Tax reform |
165 | |||||||||||
|
Ending balances |
$ | 5,032 | $ | 1,947 | $ | 1,747 | ||||||
The Company does not believe it is reasonably possible that the total amounts of unrecognized tax benefits will significantly increase in the next twelve months. The Company files income tax returns in the U.S federal and certain state tax jurisdictions, and several jurisdictions outside the U.S. The Company's federal returns are subject to tax assessment for 2016 and subsequent years. State and foreign income tax returns are generally subject to examination for a period of three to five years after filing of the respective return. The state impact of any federal changes remains subject to examination by various states for a period of up to one year after formal notification to the states.
Note 12. Segment Information:
The Company has two reportable segments based on the nature of its products; they are Protein Sciences and Diagnostics and Genomics.
The Company's Protein Sciences segment is comprised of the Reagent Solutions and the Analytical Solutions operating segment. These businesses manufacture consumables used for conducting laboratory experiments by both industry and academic scientists within the biotechnology and biomedical life science fields. No customer in the Protein Sciences segment accounted for more than 10% of the segment’s net sales for the years ended June 30, 2019, 2018, and 2017.
The Company's Diagnostics and Genomics is comprised of the Diagnostics, Genomics, and Exosome operating segments. The Diagnostics division consists of the Diagnostics operating segment and develops and manufactures a range of controls and calibrators used with diagnostic equipment and as proficiency testing tools, as well as other reagents incorporated into diagnostic kits, and the Genomics division consists of the Genomics and Exosome operating segments and sells a portfolio of clinical molecular diagnostic oncology assays, as well as tissue-based in-situ hybridization assays for research in clinical use. No customer in the Diagnostics and Genomics segment accounted for more than 10% of the segment’s net sales for the fiscal years ended June 30, 2019, 2018, and 2017.
There are no concentrations of business transacted with a particular customer or supplier or concentrations of revenue from a particular product or geographic area that would severely impact the Company in the near term.
Following is financial information relating to the operating segments (in thousands):
|
Year Ended June 30, |
||||||||||||
|
2019 |
2018 |
2017 |
||||||||||
|
Net sales: |
||||||||||||
|
Protein Sciences |
$ | 543,159 | $ | 482,378 | $ | 419,365 | ||||||
|
Diagnostics and Genomics |
171,674 | 161,151 | 143,742 | |||||||||
|
Intersegment |
(827 |
) |
(536 |
) |
(104 |
) |
||||||
|
Consolidated net sales |
$ | 714,006 | $ | 642,993 | $ | 563,003 | ||||||
|
Operating Income: |
||||||||||||
|
Protein Sciences |
$ | 240,919 | $ | 209,880 | $ | 184,095 | ||||||
|
Diagnostics and Genomics |
10,079 | 35,496 | 29,291 | |||||||||
|
Segment operating income |
250,998 | 245,376 | 213,386 | |||||||||
|
Costs recognized upon sale of acquired inventory |
(3,739 |
) |
(2,455 |
) |
(3,037 |
) |
||||||
|
Amortization of acquired intangible assets |
(58,550 |
) |
(46,983 |
) |
(44,393 |
) |
||||||
|
Acquisition related expenses |
(2,282 |
) |
(24,429 |
) |
(25,789 |
) |
||||||
|
Restructuring costs |
- |
|
(376 |
) |
- | |||||||
|
Stock-based compensation |
(33,057 |
) |
(28,240 |
) |
(14,631 |
) |
||||||
|
Corporate general, selling and administrative expenses |
(6,651 |
) |
(6,715 |
) |
(4,952 |
) |
||||||
|
Consolidated operating income |
$ | 146,719 | $ | 136,178 | $ | 120,584 | ||||||
The Company has some integrated facilities that serve multiple segments. As such, asset and capital expenditure information by reportable segment has not been provided and is not available, since the Company does not produce or utilize such information internally. In addition, although depreciation and amortization expense is a component of each reportable segment’s operating results, it is not discretely identifiable.
The Company has disclosed sales by geographic area based on the location of the customer or distributor in Note 2. The Company has disclosed dissagregated product and service revenue by consumables, instruments, and services in Note 2. The Company considers total instrument and total service revenue to represent similar groups of products in the fiscal years presented. The Company considered our consumables sold in the Protein Sciences and Diagnostics and Genomics segments to represent different groups of products and therefore have separately disclosed the related consumables revenue (in thousands) :
|
Year Ended June 30, |
||||||||||||
|
2019 |
2018 |
2017 |
||||||||||
| Consumables revenue - Protein Sciences | $ | 430,655 | $ | 384,350 | $ | 341,611 | ||||||
|
Consumables revenue - Diagnostics and Genomics |
158,324 | 150,388 | 134,930 | |||||||||
|
Total consumable revenue |
$ | 588,979 | $ | 534,738 | $ | 476,541 | ||||||
The following is financial information relating to geographic areas (in thousands):
|
Year ended June 30, |
||||||||
|
Long-lived assets: |
2019 |
2018 |
||||||
|
United States and Canada |
$ | 138,016 | $ | 129,360 | ||||
|
Europe |
14,439 | 14,597 | ||||||
|
Asia |
1,584 | 1,391 | ||||||
|
Total long-lived assets |
$ | 154,039 | $ | 145,348 | ||||
|
Intangible assets: |
||||||||
|
United States and Canada |
$ | 556,951 | $ | 417,430 | ||||
|
Europe |
16,637 | 21,386 | ||||||
|
Asia |
5,841 | 7,516 | ||||||
|
Total intangible assets |
$ | 579,429 | $ | 446,332 | ||||
Long-lived assets are comprised of land, buildings and improvements and equipment, net of accumulated depreciation and other assets.
Note 13. Quarterly Financial Data (unaudited):
|
(in thousands, except per share data) |
||||||||||||||||||||
|
2019 |
First Quarter |
Second Quarter |
Third Quarter |
Fourth Quarter |
Year |
|||||||||||||||
|
Net sales |
$ | 162,970 | $ | 174,510 | $ | 184,861 | $ | 191,664 | $ | 714,006 | ||||||||||
|
Cost of sales |
$ | 55,367 | $ | 61,492 | $ | 60,251 | $ | 63,405 | $ | 240,515 | ||||||||||
|
Net earnings |
$ | 17,403 | $ | 17,556 | $ | 44,654 | $ | 16,459 | $ | 96,072 | ||||||||||
|
Earnings per common share: |
||||||||||||||||||||
|
Basic |
$ | 0.46 | $ | 0.46 | $ | 1.18 | $ | 0.43 | $ | 2.54 | ||||||||||
|
Diluted |
$ | 0.45 | $ | 0.45 | $ | 1.15 | $ | 0.42 | $ | 2.47 | ||||||||||
|
Weighted average common shares outstanding: |
||||||||||||||||||||
|
Basic |
37,697 | 37,766 | 37,772 | 37,881 | 37,781 | |||||||||||||||
|
Diluted |
38,813 | 38,748 | 38,861 | 39,135 | 38,892 | |||||||||||||||
|
(in thousands, except per share data) |
||||||||||||||||||||
|
2018 |
First Quarter |
Second Quarter |
Third Quarter |
Fourth Quarter |
Year |
|||||||||||||||
|
Net sales |
$ | 144,613 | $ | 154,153 | $ | 163,973 | $ | 180,254 | $ | 642,993 | ||||||||||
|
Cost of sales |
$ | 46,745 | $ | 52,319 | $ | 53,712 | $ | 58,074 | $ | 210,850 | ||||||||||
|
Net earnings(1) |
$ | 15,863 | $ | 48,847 | $ | 19,738 | $ | 41,701 | $ | 126,150 | ||||||||||
|
Earnings per common share: |
||||||||||||||||||||
|
Basic |
$ | 0.42 | $ | 1.30 | $ | 0.53 | $ | 1.09 | $ | 3.36 | ||||||||||
|
Diluted |
$ | 0.42 | $ | 1.29 | $ | 0.52 | $ | 1.07 | $ | 3.31 | ||||||||||
|
Weighted average common shares outstanding: |
||||||||||||||||||||
|
Basic |
37,376 | 37,449 | 37,503 | 37,585 | 37,476 | |||||||||||||||
|
Diluted |
37,705 | 37,926 | 38,142 | 38,347 | 38,055 | |||||||||||||||
(1) Net earnings in total and per share do not sum due to rounding
Report of Independent Registered Public Accounting Firm
To the Shareholders and Board of Directors
Bio-Techne Corporation:
Opinion on the Consolidated Financial Statements
We have audited the accompanying consolidated balance sheets of Bio-Techne Corporation and subsidiaries (the Company) as of June 30, 2019 and 2018, the related consolidated statements of earnings and comprehensive income, shareholders’ equity, and cash flows for each of the years in the three-year period ended June 30, 2019, and the related notes (collectively, the consolidated financial statements). In our opinion, the consolidated financial statements present fairly, in all material respects, the financial position of the Company as of June 30, 2019 and 2018, and the results of its operations and its cash flows for each of the years in the three-year period ended June 30, 2019, in conformity with U.S. generally accepted accounting principles.
We also have audited, in accordance with the standards of the Public Company Accounting Oversight Board (United States) (PCAOB), the Company’s internal control over financial reporting as of June 30, 2019, based on criteria established in Internal Control – Integrated Framework (2013) issued by the Committee of Sponsoring Organizations of the Treadway Commission, and our report dated August 28, 2019 expressed an unqualified opinion on the effectiveness of the Company’s internal control over financial reporting.
Change in Accounting Principle
As discussed in Note 1 to the consolidated financial statements, effective July 1, 2018, the Company adopted FASB Accounting Standards Codification (Topic 606), Revenue from Contracts with Customers.
Basis for Opinion
These consolidated financial statements are the responsibility of the Company’s management. Our responsibility is to express an opinion on these consolidated financial statements based on our audits. We are a public accounting firm registered with the Public Company Accounting Oversight Board (United States) (PCAOB) and are required to be independent with respect to the Company in accordance with the U.S. federal securities laws and the applicable rules and regulations of the Securities and Exchange Commission and the PCAOB.
We conducted our audits in accordance with the standards of the PCAOB. Those standards require that we plan and perform the audit to obtain reasonable assurance about whether the consolidated financial statements are free of material misstatement, whether due to error or fraud. The Company is not required to have, nor were we engaged to perform, an audit of its internal control over financial reporting. As part of our audits, we are required to obtain an understanding of internal control over financial reporting but not for the purpose of expressing an opinion on the effectiveness of the Company’s internal control over financial reporting. Accordingly, we express no such opinion.
Our audits included performing procedures to assess the risks of material misstatement of the consolidated financial statements, whether due to error or fraud, and performing procedures that respond to those risks. Such procedures included examining, on a test basis, evidence regarding the amounts and disclosures in the consolidated financial statements. Our audits also included evaluating the accounting principles used and significant estimates made by management, as well as evaluating the overall presentation of the consolidated financial statements. We believe that our audits provide a reasonable basis for our opinion.
Critical Audit Matters
The critical audit matters communicated below are matters arising from the current period audit of the consolidated financial statements that were communicated or required to be communicated to the audit committee and that: (1) relate to accounts or disclosures that are material to the consolidated financial statements and (2) involved our especially challenging, subjective, or complex judgments. The communication of critical audit matters does not alter in any way our opinion on the consolidated financial statements, taken as a whole, and we are not, by communicating the critical audit matters below, providing separate opinions on the critical audit matters or on the accounts or disclosures to which they relate.
Initial fair value measurement of the developed technology and trade name intangible assets acquired in certain acquisitions
As discussed in Note 2 to the consolidated financial statements, the acquisition of QT Holdings Corporation, Exosome Diagnostics, Inc. and B-MoGen Biotechnologies, Inc. resulted in the recording of developed technology and trade name intangible assets of $131.3 million and $58.0 million, respectively. The determination of the acquisition date fair value of the developed technology and trade name assets required the Company to make significant estimates and assumptions regarding future revenue growth rates, and discount rates.
We identified the initial fair value measurement of the developed technology and trade name assets acquired in these transactions as a critical audit matter. Testing the assumptions regarding future revenue growth rates, and discount rates, which were used to calculate the fair values, involved a high degree of subjectivity. In addition, the fair values of these intangible assets were challenging to audit due to the sensitivity of the fair value determination to changes in these assumptions.
We performed audit procedures, including our primary procedures described below, to address this critical audit matter. We tested certain internal controls over the Company’s acquisition-date valuation process, including controls over the development of the future revenue growth rates, and discount rates. We performed sensitivity analyses over the future revenue growth rates to assess the impact of changes in those assumptions on the Company’s determination of the fair value of the intangible assets. We challenged the future revenue growth rates used by the Company to determine forecasted revenues, by comparing them to industry benchmarks and data, as well as evaluated the relevance and reliability of third-party market data points used to develop the future revenue growth rates. We evaluated the Company’s assumptions for the timing of product release used to support the future revenue growth rate by comparing them to industry benchmarks, based on the type of product and stage of the testing trials. Finally, we involved a valuation professional with specialized skills and knowledge, who assisted in evaluating the discount rate used by the Company, by comparing it against a discount rate range that was independently developed using publicly available market data for comparable entities. They also assisted in developing an estimate of the intangible assets acquired using the Company’s cash flow forecast and an independently developed discount rate. We compared the results of our estimate of fair value to the Company’s fair value estimate.
Fair value measurement of the contingent consideration liabilities related to certain acquisitions
As discussed in Note 2 to the consolidated financial statements, the initial fair value of the contingent consideration liabilities for the QT Holdings Corporation, Exosome Diagnostics, Inc. and B-MoGen Biotechnologies, Inc. acquisitions was $5.3 million, $3.8 million and $5.5 million, respectively. The contingent consideration liabilities are re-measured each reporting period, with a maximum payout of $51 million, $325 million and $38 million for QT Holdings Corporation, Exosome Diagnostics, Inc. and B-MoGen Biotechnologies Inc., respectively. The determination of the fair value of the contingent consideration liabilities requires the Company to make significant estimates and assumptions. These estimates and assumptions include the future revenue growth rates, including the timing of product release, and discount rates. The measurement of the fair value of contingent consideration for Exosome Diagnostics, Inc. also includes an estimate of future earnings before income taxes and amortization (EBITA).
We identified the initial measurement of the contingent consideration liabilities for these transactions as a critical audit matter because testing certain of the assumptions involved a high degree of subjectivity. In addition, auditing the Company’s simulation and milestone based models, which were used to determine the fair value of the contingent consideration liabilities, involved complex and challenging auditor judgment as the inputs to such models do not have directly observable market inputs.
We performed audit procedures, including our primary procedures described below, to address this critical audit matter. We tested certain internal controls over the Company’s acquisition-date valuation process for contingent consideration liabilities, including controls over the future revenue growth rates, including the timing of product release, discount rates, and EBITA assumptions. We performed sensitivity analyses over the timing of product release, revenue growth rates and EBITA assumptions. These sensitivity analyses assessed the impact of changes in these assumptions on the Company’s determination of the fair value of the contingent consideration liabilities. We challenged the revenue growth rate and EBITA assumptions used in the Company’s simulation and milestone-based models by comparing the inputs to industry benchmarks and other relevant and reliable third-party market data. We evaluated the product release timing assumptions by comparing them to industry benchmarks, based on the type of product and stage of the testing trials. Finally, we involved a valuation professional with specialized skills and knowledge, who assisted in evaluating the discount rate by comparing it against ranges that were independently developed using publicly available market data for comparable entities. Additionally, the valuation professional assisted in the evaluation of the Company’s selection of an appropriate valuation method for the contingent consideration. They also assisted in developing an estimate of the initial fair values of the contingent consideration liabilities using simulation and milestone-based models and an independently developed discount rate. We used such inputs to calculate in independent estimate of fair value using the simulation and milestone based models developed by the Company. We compared the results of our estimate of fair value for the contingent consideration liabilities to the Company’s fair value estimate.
/s/ KPMG LLP
We have served as the Company’s auditor since 2002.
Minneapolis, Minnesota
August 28, 2019
Report of Independent Registered Public Accounting Firm
To the Shareholders and Board of Directors
Bio-Techne Corporation:
Opinion on Internal Control Over Financial Reporting
We have audited Bio-Techne Corporation and subsidiaries’ (the Company) internal control over financial reporting as of June 30, 2019, based on criteria established in Internal Control – Integrated Framework (2013) issued by the Committee of Sponsoring Organizations of the Treadway Commission. In our opinion, the Company maintained, in all material respects, effective internal control over financial reporting as of June 30, 2019, based on criteria established in Internal Control – Integrated Framework (2013) issued by the Committee of Sponsoring Organizations of the Treadway Commission.
We also have audited, in accordance with the standards of the Public Company Accounting Oversight Board (United States) (PCAOB), the consolidated balance sheets of the Company as of June 30, 2019 and 2018, the related consolidated statements of earnings and comprehensive income, shareholders’ equity, and cash flows for each of the years in the three-year period ended June 30, 2019, and the related notes (collectively, the consolidated financial statements), and our report dated August 28, 2019 expressed an unqualified opinion on those consolidated financial statements.
The Company acquired QT Holdings Corporation, Exosome Diagnostics, Inc. and B-MoGen Biotechnologies, Inc. during fiscal 2019 and management excluded from its assessment of the effectiveness of the Company’s internal control over financial reporting as of June 30, 2019, QT Holdings Corporation, Exosome Diagnostics, Inc. and B-MoGen Biotechnologies, Inc.’s internal control over financial reporting associated with total assets of 17.2% and total revenue of 0.5% included in the consolidated financial statements of the Company as of and for the year ended June 30, 2019. Our audit of internal control over financial reporting of the Company also excluded an evaluation of the internal control over financial reporting of QT Holdings Corporation, Exosome Diagnostics, Inc. and B-MoGen Biotechnologies, Inc.
Basis for Opinion
The Company’s management is responsible for maintaining effective internal control over financial reporting and for its assessment of the effectiveness of internal control over financial reporting, included in the accompanying Management’s Annual Report on Internal Control Over Financial Reporting. Our responsibility is to express an opinion on the Company’s internal control over financial reporting based on our audit. We are a public accounting firm registered with the PCAOB and are required to be independent with respect to the Company in accordance with the U.S. federal securities laws and the applicable rules and regulations of the Securities and Exchange Commission and the PCAOB.
We conducted our audit in accordance with the standards of the PCAOB. Those standards require that we plan and perform the audit to obtain reasonable assurance about whether effective internal control over financial reporting was maintained in all material respects. Our audit of internal control over financial reporting included obtaining an understanding of internal control over financial reporting, assessing the risk that a material weakness exists, and testing and evaluating the design and operating effectiveness of internal control based on the assessed risk. Our audit also included performing such other procedures as we considered necessary in the circumstances. We believe that our audit provides a reasonable basis for our opinion.
Definition and Limitations of Internal Control Over Financial Reporting
A company’s internal control over financial reporting is a process designed to provide reasonable assurance regarding the reliability of financial reporting and the preparation of financial statements for external purposes in accordance with generally accepted accounting principles. A company’s internal control over financial reporting includes those policies and procedures that (1) pertain to the maintenance of records that, in reasonable detail, accurately and fairly reflect the transactions and dispositions of the assets of the company; (2) provide reasonable assurance that transactions are recorded as necessary to permit preparation of financial statements in accordance with generally accepted accounting principles, and that receipts and expenditures of the company are being made only in accordance with authorizations of management and directors of the company; and (3) provide reasonable assurance regarding prevention or timely detection of unauthorized acquisition, use, or disposition of the company’s assets that could have a material effect on the financial statements.
Because of its inherent limitations, internal control over financial reporting may not prevent or detect misstatements. Also, projections of any evaluation of effectiveness to future periods are subject to the risk that controls may become inadequate because of changes in conditions, or that the degree of compliance with the policies or procedures may deteriorate.
/s/ KPMG LLP
Minneapolis, Minnesota
August 28, 2019
ITEM 9. CHANGES IN AND DISAGREEMENTS WITH ACCOUNTANTS ON ACCOUNTING AND FINANCIAL DISCLOSURE
None.
ITEM 9A. CONTROLS AND PROCEDURES
|
(a) |
Evaluation of Disclosure Controls and Procedures |
As required by Rule 13a-15(b) of the Securities Exchange Act of 1934 (the "Exchange Act"), management, with the participation of our Chief Executive Officer and Chief Financial Officer, evaluated, as of the end of the period covered by this report, the effectiveness of our disclosure controls and procedures as defined in Exchange Act Rule 13a-15(e). The evaluation was based upon reports and certifications provided by a number of executives. Based on that evaluation, our Chief Executive Officer and Chief Financial Officer concluded that, as of June 30, 2019, our disclosure controls and procedures were effective.
|
(b) |
Management's Annual Report on Internal Control Over Financial Reporting |
The Company's internal control over financial reporting is a process designed to provide reasonable assurance regarding the reliability of financial reporting and the preparation of financial statements for external purposes in accordance with generally accepted accounting principles. A company's internal control over financial reporting also includes those policies and procedures that:
|
(i) |
Pertain to the maintenance of records that, in reasonable detail, accurately and fairly reflect the transactions and dispositions of the assets of the company; |
|
|
|
|
(ii)
|
Provide reasonable assurance that transactions are recorded as necessary to permit preparation of financial statements in accordance with generally accepted accounting principles, and that receipts and expenditures of the company are being made only in accordance with authorizations of management and directors of the company; and |
|
|
|
|
(iii) |
Provide reasonable assurance regarding prevention or timely detection of unauthorized acquisition, use or disposition of the company's assets that could have a material effect on the financial statements. |
Because of its inherent limitations, internal control over financial reporting may not prevent or detect misstatements. Also, projections of any evaluation of effectiveness to future periods are subject to the risk that controls may become inadequate because of changes in conditions, or that the degree of compliance with the policies or procedures may deteriorate.
Because of its inherent limitations, internal control over financial reporting may not prevent or detect misstatements. Also, projections of any evaluation of effectiveness to future periods are subject to the risk that controls may become inadequate because of changes in conditions, or that the degree of compliance with the policies or procedures may deteriorate.
A material weakness is a deficiency, or combination of deficiencies, in internal control over financial reporting such that there is a reasonable possibility that a material misstatement of the Company's annual or interim financial statements will not be prevented or detected on a timely basis.
We acquired QT Holding Corporation (Quad) on July 2, 2018, Exosome Diagnostics Inc. (Exosome) on August 1, 2018, and BMG Merger Sub, Inc (B-Mogen) on June 4, 2019 . Quad, Exosome, and B-Mogen represented approximately 17.2% of our total assets and 0.5% of our total revenues as of and for the year ended June 30, 2019. We excluded internal control over financial reporting associated with Quad, Exosome, and B-Mogen from our assessment of the effectiveness of our internal control over financial reporting as of June 30, 2019.
Under the supervision of the Audit Committee of the Board of Directors and with the participation of our management, including our Chief Executive Officer and Chief Financial Officer, we conducted an evaluation of the effectiveness of our internal control over financial reporting using the criteria established in Internal Control - Integrated Framework (2013) issued by the Committee of Sponsoring Organizations of the Treadway Commission (COSO). Based on our assessment and those criteria, our Chief Executive Officer and Chief Financial Officer concluded that our internal control over financial reporting was effective as of June 30, 2019.
The attestation report on our internal control over financial reporting issued by KPMG LLP appears in Item 8 of this report.
|
(c) |
Changes in Internal Control Over Financial Reporting |
As previously announced, we acquired Quad on July 2, 2018, Exosome on August 1, 2018, and B-Mogen on June 4, 2019. We have not fully evaluated any changes in internal control over financial reporting associated with these acquisitions and therefore any material changes that may result from these acquisitions have not been disclosed in this report. We intend to disclose all material changes resulting from these acquisitions within or prior to the time of our first annual assessment of internal control over financial reporting that is required to include these entities.
There were no other changes in the Company's internal control over financial reporting during fiscal year 2019 that have materially affected, or are reasonably likely to materially affect, the Company's internal control over financial reporting.
None.
ITEM 10. DIRECTORS, EXECUTIVE OFFICERS AND CORPORATE GOVERNANCE
Other than "Executive Officers of the Registrant" which is set forth at the end of Item 1 in Part I of this report, the information required by Item 10 is incorporated herein by reference to the sections entitled "Election of Directors," "Principle Shareholders" and "Additional Corporate Governance Matters" in the Company's Proxy Statement for its 2019 Annual Meeting of Shareholders which will be filed with the Securities and Exchange Commission pursuant to Regulation 14A within 120 days after the close of the fiscal year for which this report is filed.
ITEM 11. EXECUTIVE COMPENSATION
The information required by Item 11 is incorporated herein by reference to the sections entitled "Election of Directors" and "Executive Compensation" in the Company's Proxy Statement for its 2019 Annual Meeting of Shareholders which will be filed with the Securities and Exchange Commission pursuant to Regulation 14A within 120 days after the close of the fiscal year for which this report is filed.
ITEM 12. SECURITY OWNERSHIP OF CERTAIN BENEFICIAL
OWNERS AND MANAGEMENT AND RELATED SHAREHOLDER MATTERS
The information required by Item 12 is incorporated by reference to the sections entitled "Principal Shareholders" and "Management Shareholdings" in the Company's Proxy Statement for its 2019 Annual Meeting of Shareholders which will be filed with the Securities and Exchange Commission pursuant to Regulation 14A within 120 days after the close of the fiscal year for which this report is filed.
ITEM 13. CERTAIN RELATIONSHIPS AND RELATED TRANSACTIONS, AND DIRECTOR INDEPENDENCE
The information required by Item 13 is incorporated by reference to the sections entitled "Election of Directors" and "Additional Corporate Governance Matters" in the Company's Proxy Statement for its 2019 Annual Meeting of Shareholders which will be filed with the Securities and Exchange Commission pursuant to Regulation 14A within 120 days after the close of the fiscal year for which this report is filed.
ITEM 14. PRINCIPAL ACCOUNTING FEES AND SERVICES
The information required by Item 14 is incorporated herein by reference to the section entitled "Audit Matters" in the Company's Proxy Statement for its 2019 Annual Meeting of Shareholders which will be filed with the Securities and Exchange Commission pursuant to Regulation 14A within 120 days after the close of the fiscal year for which this report is filed.
ITEM 15. EXHIBITS, FINANCIAL STATEMENT SCHEDULES
A. (1) List of Financial Statements.
The following Consolidated Financial Statements are filed as part of this Annual Report on Form 10-K:
Consolidated Statements of Earnings and Comprehensive Income for the Years Ended June 30, 2019, 2018, and 2017
Consolidated Balance Sheets as of June 30, 2019 and 2018
Consolidated Statements of Shareholders' Equity for the Years Ended June 30, 2019, 2018, and 2017
Consolidated Statements of Cash Flows for the Years Ended June 30, 2019, 2018, and 2017
Notes to Consolidated Financial Statements for the Years Ended June 30, 2019, 2018, and 2017
Reports of Independent Registered Public Accounting Firm
A. (2) Financial Statement Schedules.
All financial statement schedules are omitted because they are not applicable, not material or the required information is shown in the Consolidated Financial Statements or Notes thereto.
A. (3) Exhibits.
for Form 10-K for the 2019 Fiscal Year
|
Exhibit Number |
Description |
|
3.1 |
|
|
|
|
|
3.2 |
|
|
|
|
|
10.1** |
|
|
|
|
|
10.2** |
|
|
|
|
|
10.3** |
|
|
|
|
|
10.4** |
|
|
|
|
|
10.5** |
|
|
|
|
|
10.6** |
|
|
|
|
|
10.7** |
|
|
|
|
|
10.8** |
|
|
|
|
|
10.9** |
|
Exhibit Number |
Description |
|
10.10** |
|
|
|
|
|
10.11 |
|
|
|
|
|
10.12** |
|
|
|
|
|
10.13 |
|
|
|
|
|
10.14 |
|
|
|
|
|
21 |
|
|
|
|
|
23 |
Consent of KPMG LLP, Independent Registered Public Accounting Firm |
|
|
|
|
31.1 |
Certification of Chief Executive Officer pursuant to Section 302 of the Sarbanes-Oxley Act of 2002 |
|
|
|
|
31.2 |
Certification of Chief Financial Officer pursuant to Section 302 of the Sarbanes-Oxley Act of 2002 |
|
|
|
|
32.1 |
Certification of Chief Executive Officer pursuant to Section 906 of the Sarbanes-Oxley Act of 2002 |
|
|
|
|
32.2 |
Certification of Chief Financial Officer pursuant to Section 906 of the Sarbanes-Oxley Act of 2002 |
|
|
|
|
101 |
The following financial statements from the Company's Annual Report on Form 10-K for the fiscal year ended June 30, 2019, formatted in Extensible Business Reporting Language (XBRL): (i) the Consolidated Statements of Earnings and Comprehensive Income, (ii) the Consolidated Balance Sheets, (iii) the Consolidated Statements of Shareholders' Equity, (iv) the Consolidated Statements of Cash Flows, and (v) Notes to the Consolidated Financial Statements. |
-------------
* Incorporated by reference; SEC File No. 000-17272
** Management contract or compensatory plan or arrangement
Exhibits for Form 10-K have not been included in this report. Exhibits have been filed with the Securities and Exchange Commission. Upon request to the Investor Relations Department, Bio-Techne Corporation will furnish, without charge, any such exhibits as well as copies of periodic reports filed with the Securities and Exchange Commission.
None.
Pursuant to the requirements of Section 13 or 15(d) of the Securities Exchange Act of 1934, the Registrant has duly caused this Report to be signed on its behalf by the undersigned, thereunto duly authorized.
|
|
BIO-TECHNE CORPORATION |
|
|
|
|
|
|
|
|
|
|
|
|
|
Date: August 28, 2019 |
|
/s/ Charles Kummeth |
|
|
|
|
By: Charles Kummeth |
|
|
|
|
Its: President and CEO |
|
Pursuant to the requirements of the Securities Exchange Act of 1934, this Report has been signed by the following persons on behalf of the Registrant and in the capacities and on the dates indicated.
|
Date |
Signature and Title |
|
|
|
|
August 28, 2019 |
/s/ Robert V. Baumgartner |
|
|
Robert V. Baumgartner |
|
|
Chairman of the Board and Director |
|
|
|
|
August 28, 2019 |
/s/ Rupert Vessey |
|
|
Dr. Rupert Vessey, Director |
|
|
|
|
August 28, 2019 |
/s/ Joseph Keegan, Ph.D. |
|
|
Dr. Joseph Keegan, Director |
|
|
|
|
August 28, 2019 |
/s/ John L. Higgins |
|
|
John L. Higgins, Director |
|
|
|
|
August 28, 2019 |
/s/ Roeland Nusse, Ph.D. |
|
|
Dr. Roeland Nusse, Director |
|
|
|
|
August 28, 2019 |
/s/ Alpna Seth, Ph.D. |
|
|
Dr. Alpna Seth, Director |
|
|
|
|
August 28, 2019 |
/s/ Randolph C. Steer, Ph.D., M.D. |
|
|
Dr. Randolph C. Steer, Director |
|
|
|
|
August 28, 2019 |
/s/ Harold J. Wiens |
|
|
Harold J. Wiens, Director |
|
|
|
|
August 28, 2019 |
/s/ Charles Kummeth |
|
|
Charles Kummeth, Director and Chief Executive Officer (principal executive officer) |
|
|
|
|
August 28, 2019 |
/s/ James Hippel |
|
|
James Hippel, Chief Financial Officer |
|
|
(principal financial officer and principal accounting officer) |
78